Figure 6
Download original image
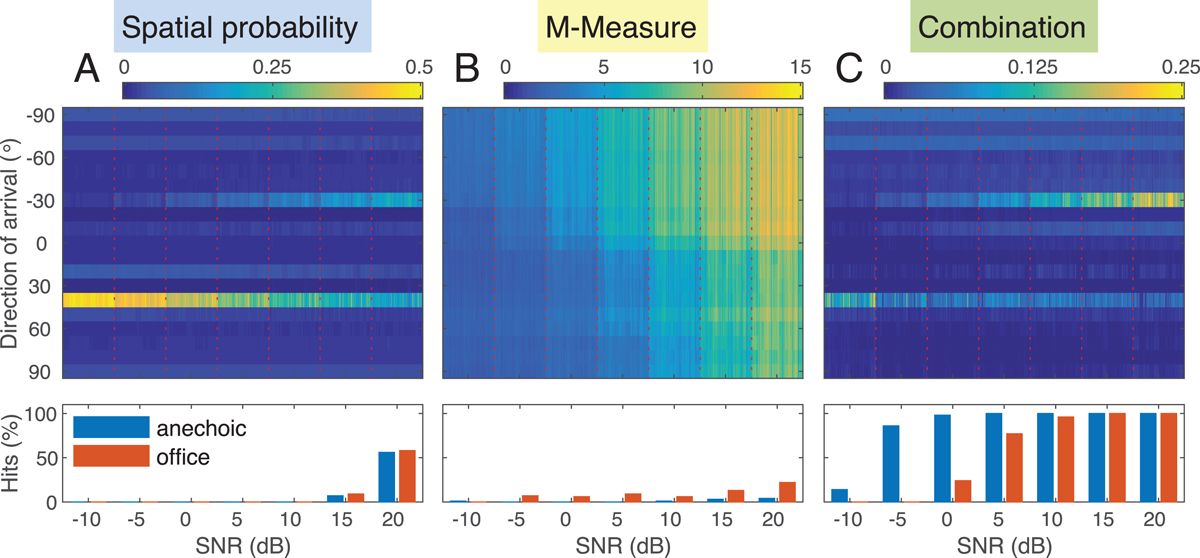
Results based on the M-Measure obtained for a single speech source with −30° DOA and a localized interferer (vacuum cleaner) with 40° DOA at varying SNR (−10 dB to 20 dB, abscissa). Top row: Results are shown for the office environment. Outcomes of stages B, E, and F in Figure 1. Left panel (A): DOA-dependent probability of sound source presence P
DOA(α) (Eq. (11)). Center panel (B): M-Measure (MM, Eq. (7)) obtained from phoneme posteriorgram output of a deep neural network for speech recognition as a measure of direction-dependent speech quality. Right panel (C): Combination of spatial source probability and ASR-based speech quality measure ![]() (Eq. (12)) recovers the speech source location from the mixture with the dominant interferer. Bottom row: Speech location detection performance (hit rate) based the information presented above and using Equations A: (14), B: (15), and C: (13) in the anechoic (blue bars) and the office (red bars) environment.
(Eq. (12)) recovers the speech source location from the mixture with the dominant interferer. Bottom row: Speech location detection performance (hit rate) based the information presented above and using Equations A: (14), B: (15), and C: (13) in the anechoic (blue bars) and the office (red bars) environment.
Current usage metrics show cumulative count of Article Views (full-text article views including HTML views, PDF and ePub downloads, according to the available data) and Abstracts Views on Vision4Press platform.
Data correspond to usage on the plateform after 2015. The current usage metrics is available 48-96 hours after online publication and is updated daily on week days.
Initial download of the metrics may take a while.