Figure 6
Download original image
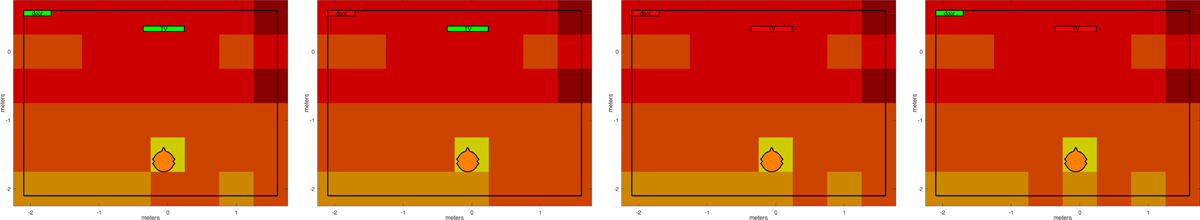
Illustration of the effect of switching on and off noise sources on the spatial speech recognition map with the hearing-impaired profile (indicated by the orange head symbol). Green boxes with text indicate a muted noise source, red boxes an active noise source. The legend of the color encoded speech levels is identical to the one in Figure 3.
Current usage metrics show cumulative count of Article Views (full-text article views including HTML views, PDF and ePub downloads, according to the available data) and Abstracts Views on Vision4Press platform.
Data correspond to usage on the plateform after 2015. The current usage metrics is available 48-96 hours after online publication and is updated daily on week days.
Initial download of the metrics may take a while.