Figure 4
Download original image
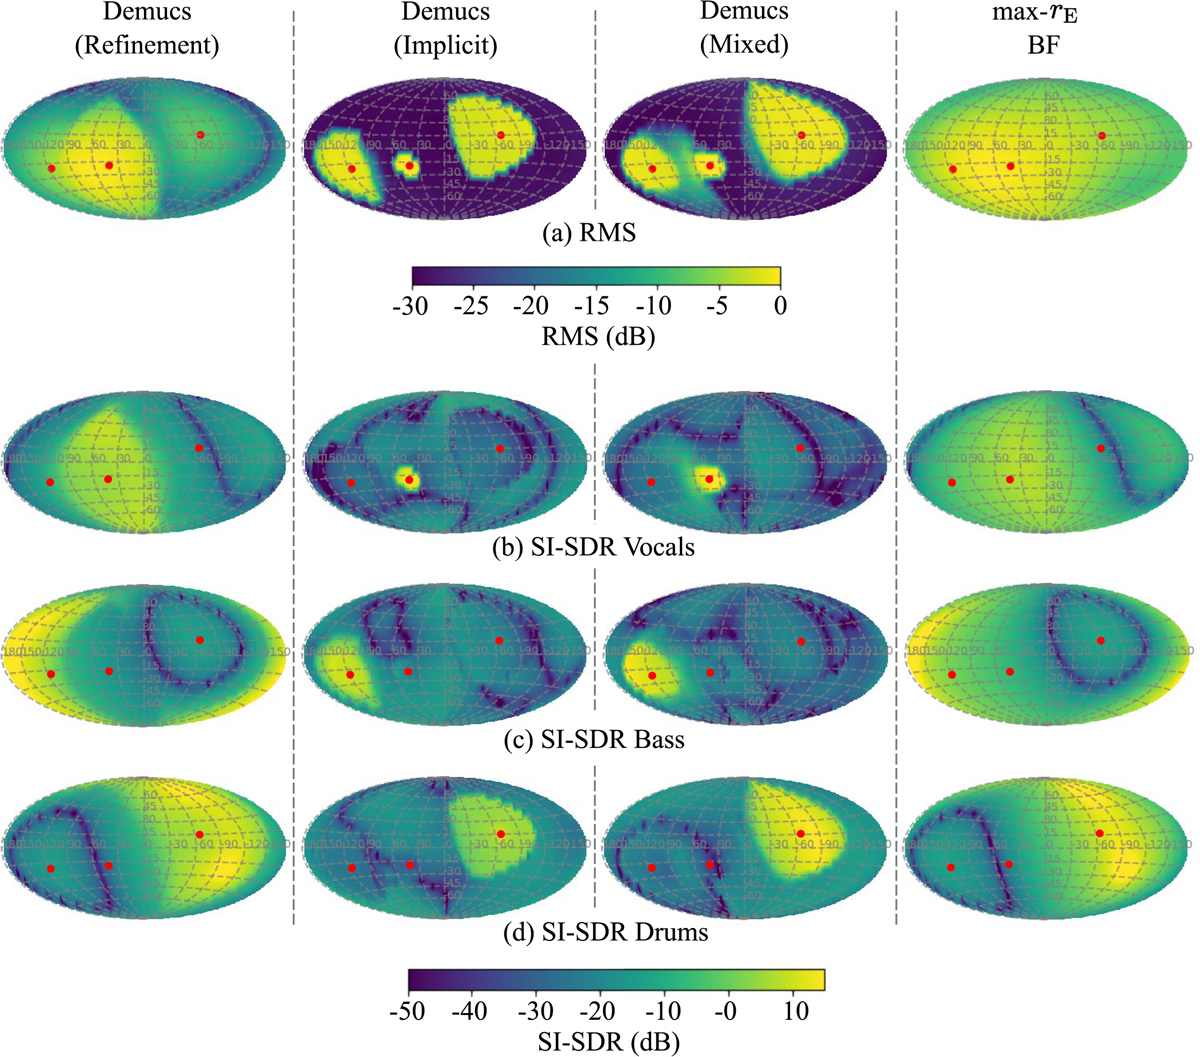
Visualization of (a) RMS and (b), (c), (d) SI-SDR for audio predicted in a discrete set of equiangularly distributed directions (100° × 50°) by several methods. The predictions are made using a first order Ambisonics mixture from the Musdb18 test set in anechoic conditions. The red dots correspond to the location of the sources. Corresponding listening examples can be found online [21].
Current usage metrics show cumulative count of Article Views (full-text article views including HTML views, PDF and ePub downloads, according to the available data) and Abstracts Views on Vision4Press platform.
Data correspond to usage on the plateform after 2015. The current usage metrics is available 48-96 hours after online publication and is updated daily on week days.
Initial download of the metrics may take a while.