Figure 3
Download original image
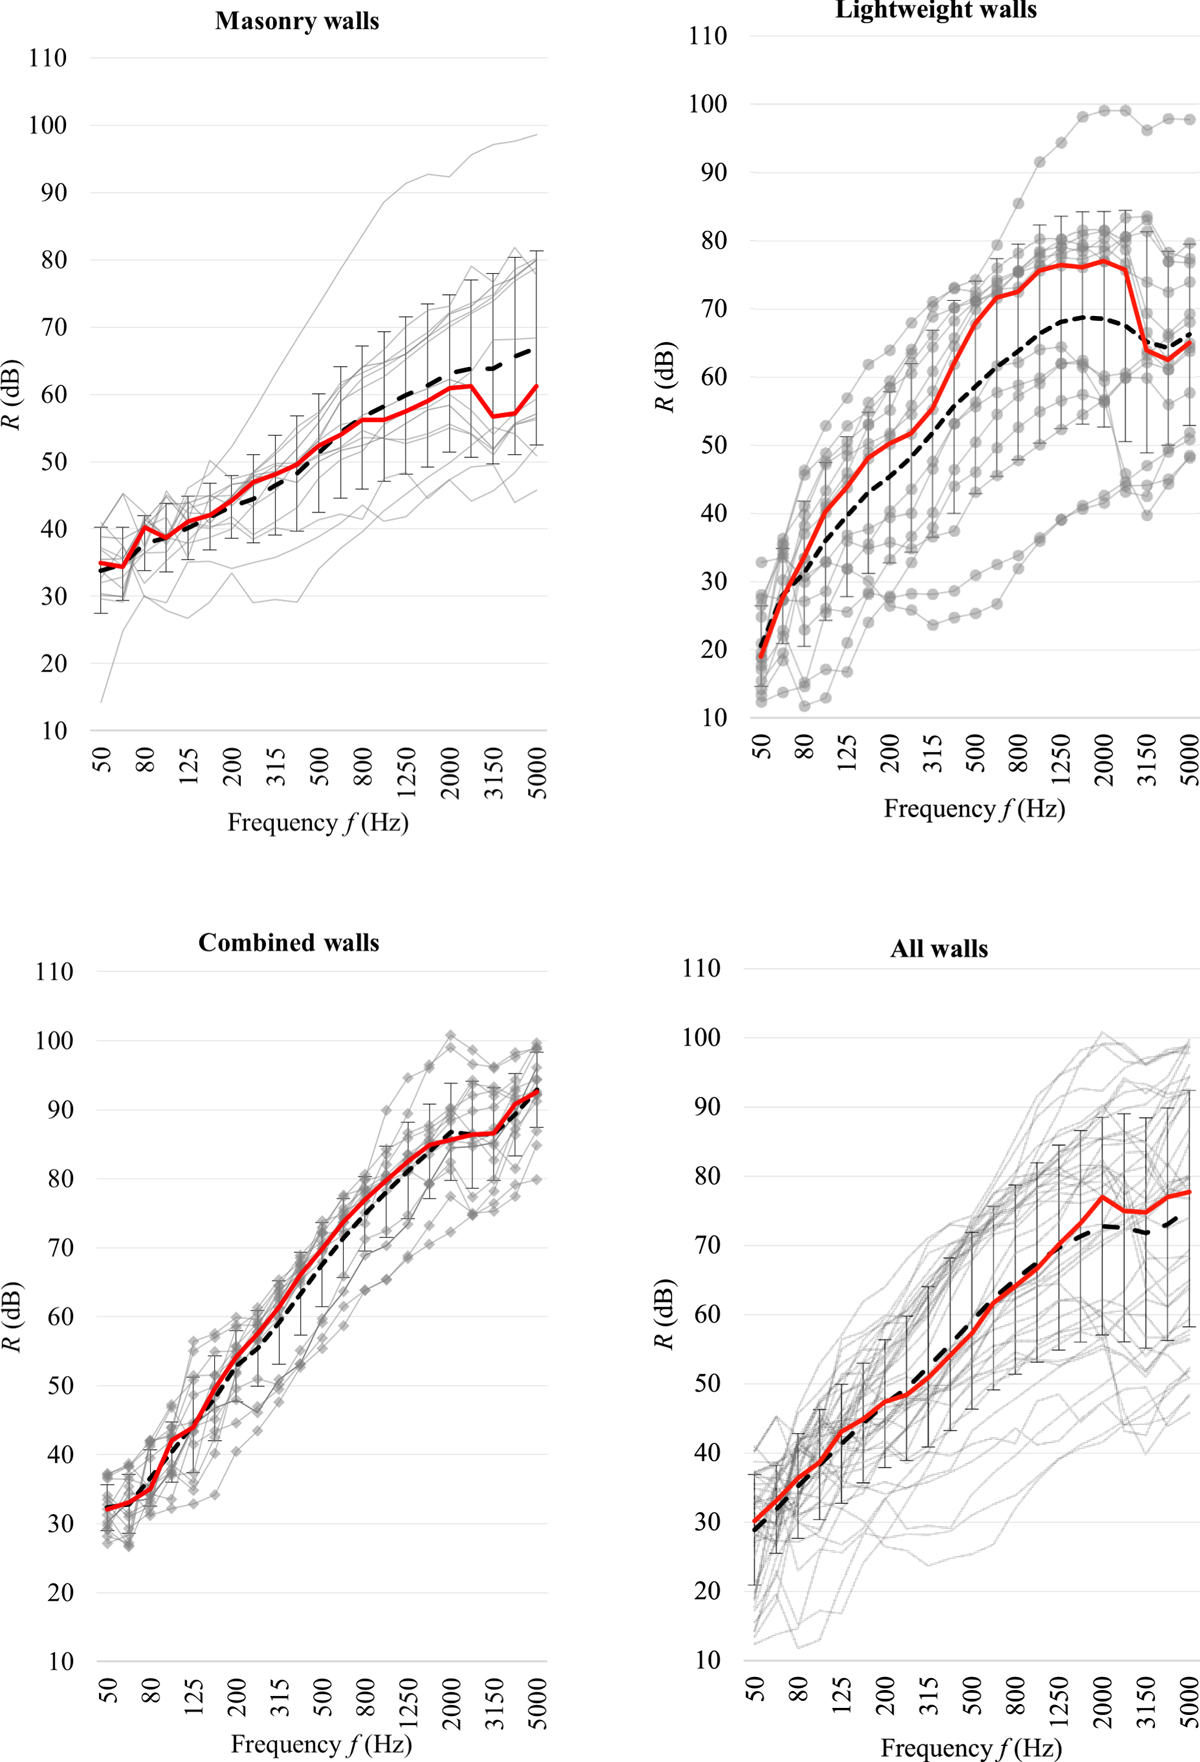
Sound reduction index R (dB) of all considered walls (grey curves), average spectrum (dashed black curve) with standard deviation (error bars) and median spectrum (red curve). The 4 panels show the spectra for masonry walls (top left), lightweight walls (top right), combined walls (bottom left) and all walls together (bottom right).
Current usage metrics show cumulative count of Article Views (full-text article views including HTML views, PDF and ePub downloads, according to the available data) and Abstracts Views on Vision4Press platform.
Data correspond to usage on the plateform after 2015. The current usage metrics is available 48-96 hours after online publication and is updated daily on week days.
Initial download of the metrics may take a while.