Open Access
Figure 7
Download original image
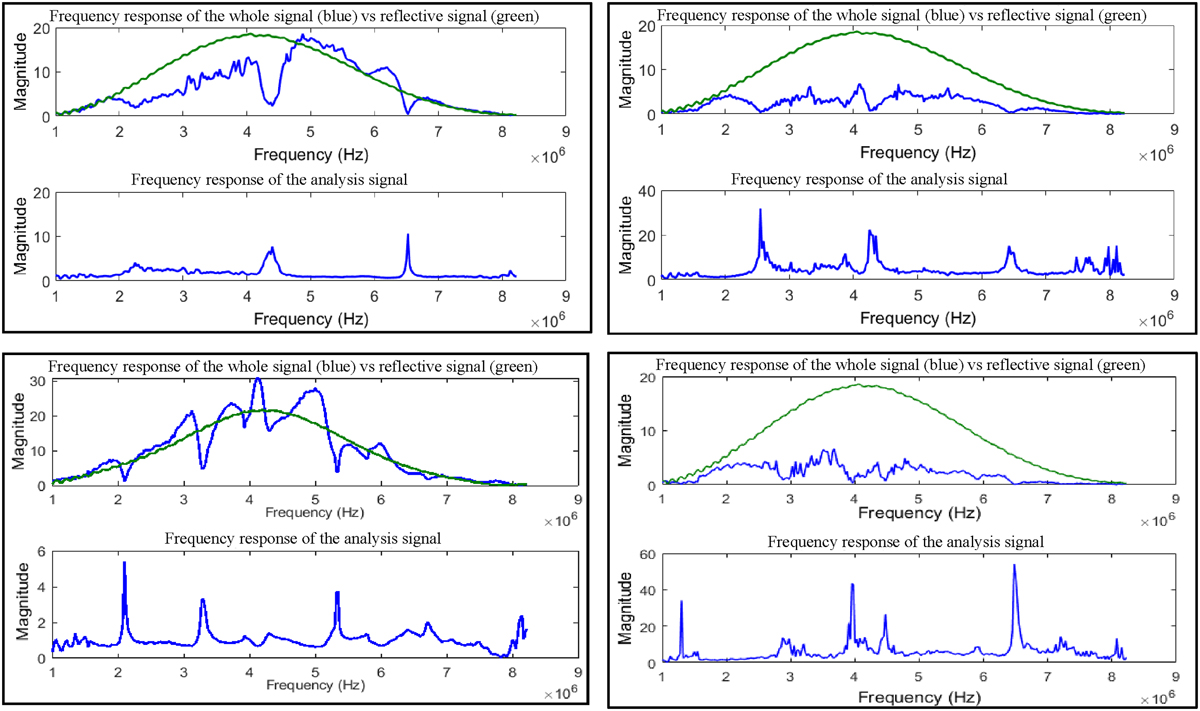
Frequency spectra of the whole signals (blue, top of each frame), the first wave packet of the signals (green), and the difference of the two frequencies (bottom of each frame) are depicted for Cu-wires with a variable number of twists per meter Ntpm, 5 (top left), 14 (top right), 19 (bottom left) and 29 (bottom right).
Current usage metrics show cumulative count of Article Views (full-text article views including HTML views, PDF and ePub downloads, according to the available data) and Abstracts Views on Vision4Press platform.
Data correspond to usage on the plateform after 2015. The current usage metrics is available 48-96 hours after online publication and is updated daily on week days.
Initial download of the metrics may take a while.