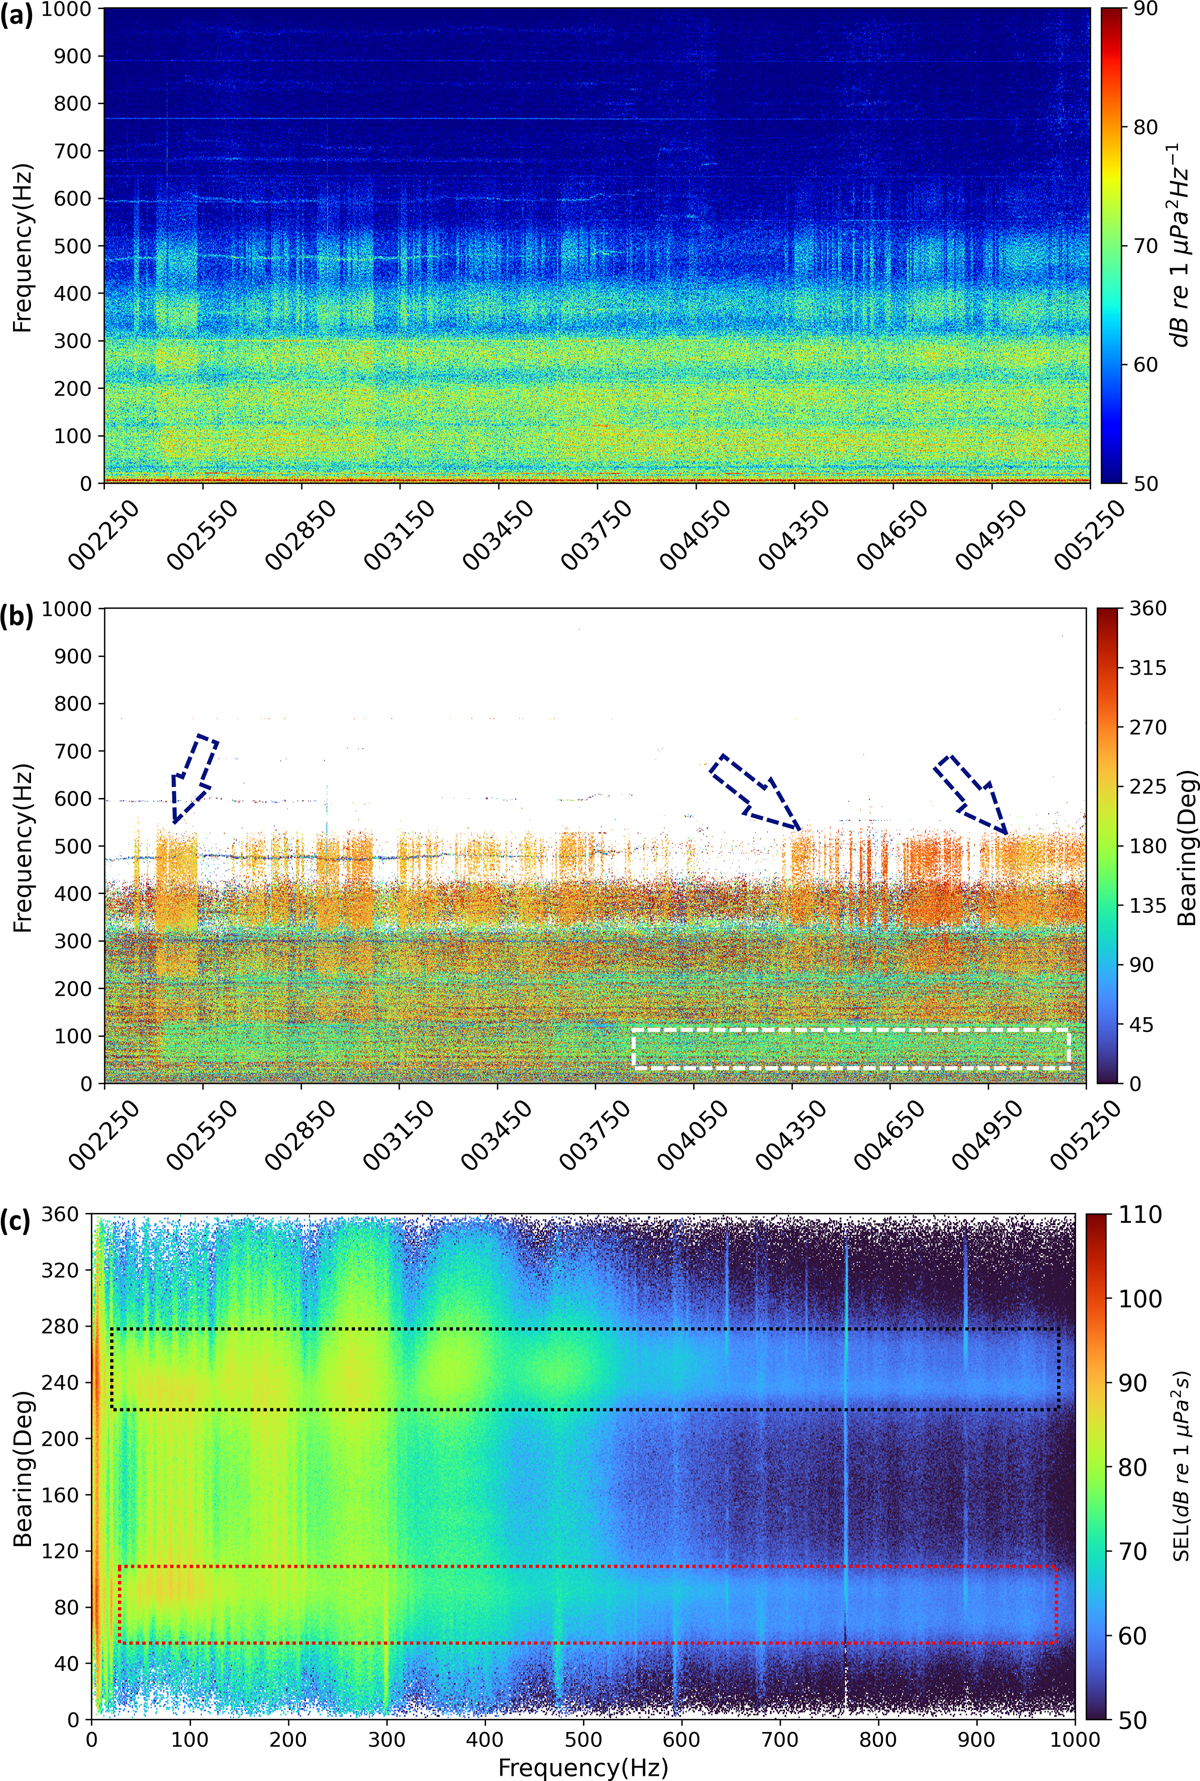
Figure 7
Download original image
Example of 30 min noise measurements on 21 May 2022 at night. (a) Spectrogram of power spectral density. (c) Azigram showing only the bearings for the data points in (a) that are >65 dB. The 65 dB is chosen for visualization purposes. The white color denotes the non-visualized bearings. (c) Accumulated energy distribution over 30 min versus bearing and frequency. In (a) and (b), the x-axis is time (HHMMSS) and calculation parameters are shown in Table 1. In (c), the frequency and bearing resolutions are 1 Hz and 1°.
Current usage metrics show cumulative count of Article Views (full-text article views including HTML views, PDF and ePub downloads, according to the available data) and Abstracts Views on Vision4Press platform.
Data correspond to usage on the plateform after 2015. The current usage metrics is available 48-96 hours after online publication and is updated daily on week days.
Initial download of the metrics may take a while.