Figure 3
Download original image
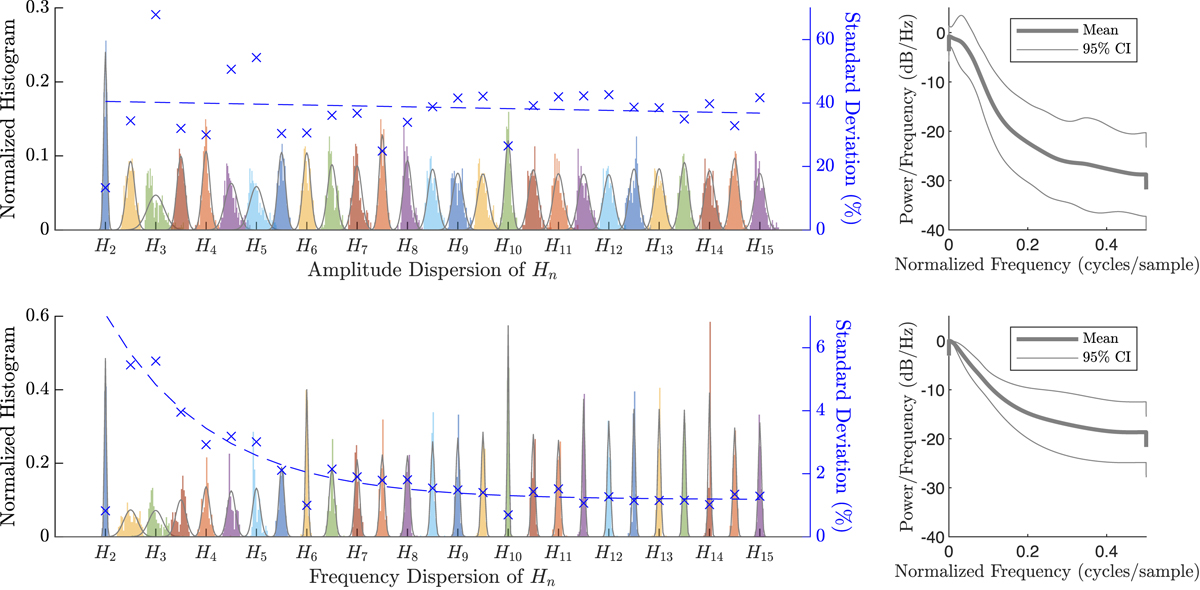
Top left: Amplitude dispersion of Hn from its mean expressed in percent starting at H2 and fitted Gaussian distributions extracted from a constant speed measurement of 9.3 s (corresponding to 937 time frames). Blue crosses indicate the standard deviation of the corresponding amplitude dispersion. Top right: Mean and 95% confidence interval of the power spectral densities of all amplitude dispersions estimated with autoregressive models of order 20. Bottom left: Frequency dispersion of Hn from its expected value deduced from engine speed expressed in percent starting at H2 and fitted Gaussian distributions extracted from a constant speed measurement of 9.3 s (corresponding to 937 time frames). Blue crosses indicate the standard deviation of the corresponding frequency dispersion. Bottom right: Mean and 95% confidence interval of the power spectral densities of all frequency dispersions estimated with autoregressive models of order 20. Data are from a constant speed measurement in a compact urban vehicle.
Current usage metrics show cumulative count of Article Views (full-text article views including HTML views, PDF and ePub downloads, according to the available data) and Abstracts Views on Vision4Press platform.
Data correspond to usage on the plateform after 2015. The current usage metrics is available 48-96 hours after online publication and is updated daily on week days.
Initial download of the metrics may take a while.