Figure 7
Download original image
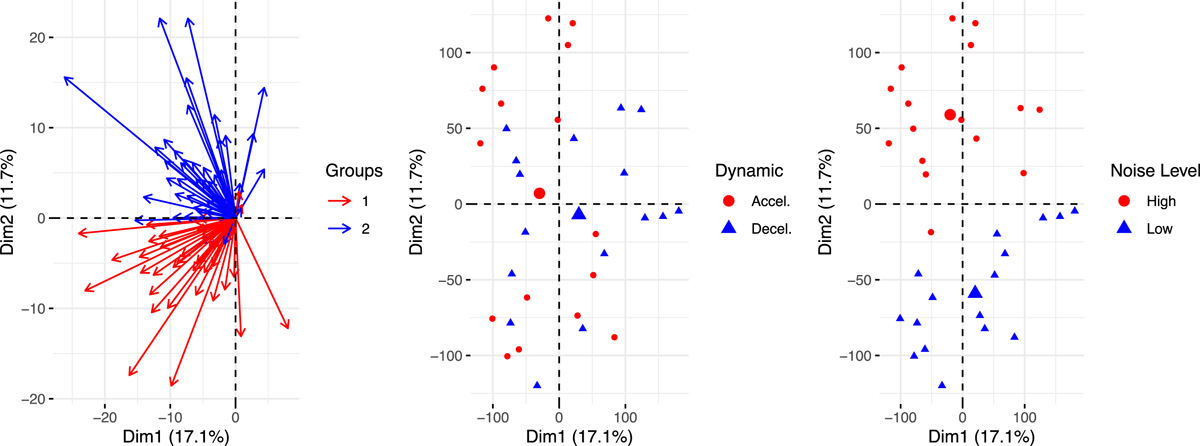
Principal component analysis of ICEV centered data. Left: Projection of participants on the first two dimensions of the principal component analysis, each arrow corresponds to the ratings of one participant, the color corresponds to his group formed by decomposition on latent components. Center and right: Projection of stimuli on the first two dimensions, each point corresponds to one stimulus. Point color indicates the factors Dynamic (center) and Noise (right), larger points are the centroid of the corresponding set of stimuli.
Current usage metrics show cumulative count of Article Views (full-text article views including HTML views, PDF and ePub downloads, according to the available data) and Abstracts Views on Vision4Press platform.
Data correspond to usage on the plateform after 2015. The current usage metrics is available 48-96 hours after online publication and is updated daily on week days.
Initial download of the metrics may take a while.