Figure 7

Download original image
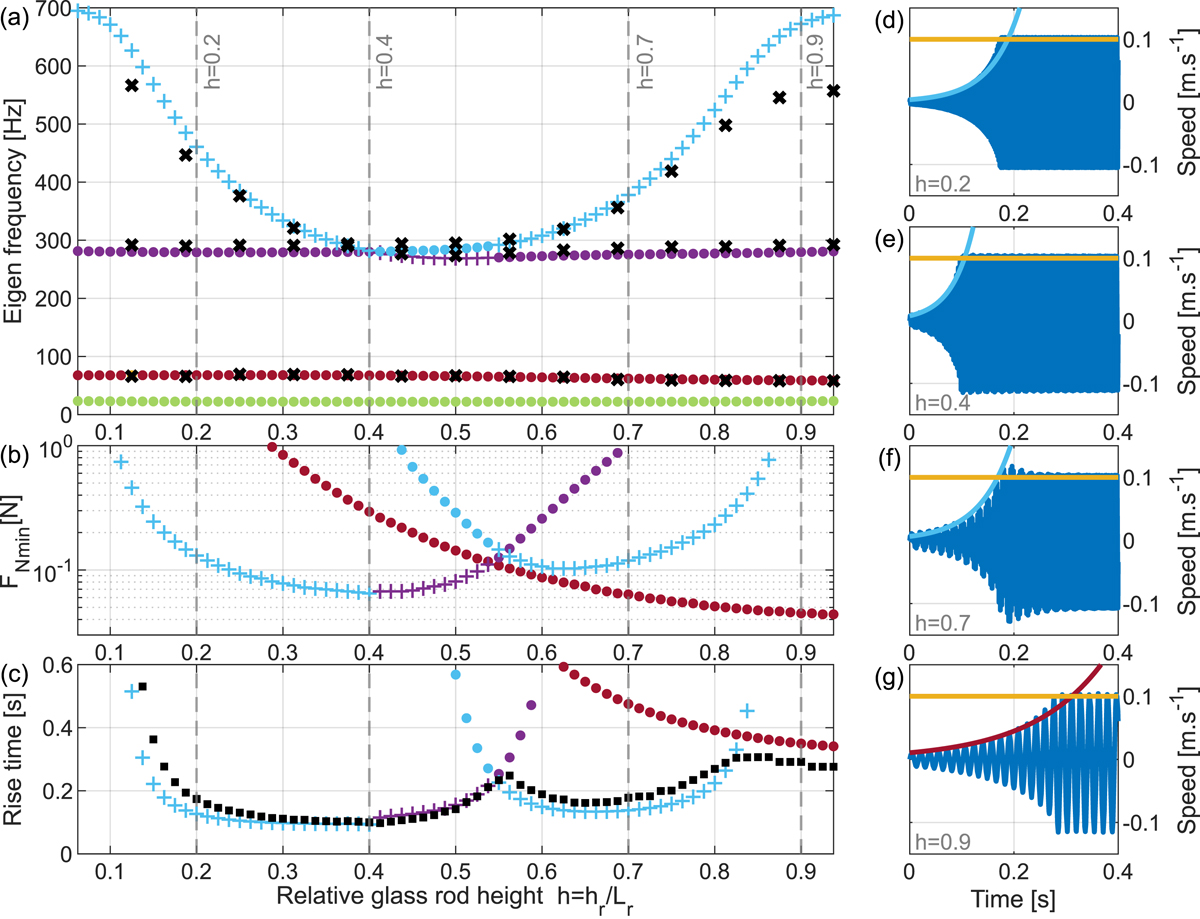
(a) Eigenfrequency versus the relative height of the glass rod, black crosses (×) refer to experimental frequency, colored crosses (+) correspond to the principal mode (closest to mode 7), colored points correspond to other modes; (b) Minimal applied force to destabilize each pole with ![]() = 0.1 m.s−1, this playability criteria is calculated by LSA, the colors refer to the color of mode in (a); (c) rise time for each relative height of glass rod with FN = 1 N and
= 0.1 m.s−1, this playability criteria is calculated by LSA, the colors refer to the color of mode in (a); (c) rise time for each relative height of glass rod with FN = 1 N and ![]() = 0.1 m.s−1, black squares are calculated from the time-domain simulation; colored dots and crosses correspond to rise time calculated by LSA of each pole in (a); (d), (e), (f) and (g) represent the speed versus time with FN = 1 N and
= 0.1 m.s−1, black squares are calculated from the time-domain simulation; colored dots and crosses correspond to rise time calculated by LSA of each pole in (a); (d), (e), (f) and (g) represent the speed versus time with FN = 1 N and ![]() = 0.1 m.s−1: for the finger (orange) and for the resonator (blue). The envelope is calculated with LSA, the color corresponds to poles in (a).
= 0.1 m.s−1: for the finger (orange) and for the resonator (blue). The envelope is calculated with LSA, the color corresponds to poles in (a).
Current usage metrics show cumulative count of Article Views (full-text article views including HTML views, PDF and ePub downloads, according to the available data) and Abstracts Views on Vision4Press platform.
Data correspond to usage on the plateform after 2015. The current usage metrics is available 48-96 hours after online publication and is updated daily on week days.
Initial download of the metrics may take a while.


