| Issue |
Acta Acust.
Volume 6, 2022
|
|
|---|---|---|
| Article Number | 26 | |
| Number of page(s) | 8 | |
| Section | Ultrasonics | |
| DOI | https://doi.org/10.1051/aacus/2022023 | |
| Published online | 30 June 2022 | |
Scientific Article
Ultrasonic investigation of the effect of compressive strains on 3D periodic bi-material structures
1
IRL 2958 Georgia Tech – CNRS, Georgia Tech Europe, George W. Woodruff School of Mechanical Engineering Georgia Institute of Technology, 2 rue Marconi, 57070 Metz, France
2
Department of Mechanical Engineering, Texas Tech University, 2500 Broadway, Lubbock, Texas 79409, USA
3
Arts et Métiers ParisTech, LEM3 UMR CNRS 7239, 4 Rue Augustin Fresnel, 57078 Metz, France
* Corresponding author: This email address is being protected from spambots. You need JavaScript enabled to view it.
Received:
6
April
2021
Accepted:
13
June
2022
Abstract
Due to the specific elastic properties such as high stiffness to mass ratio, regular microstructure materials are widely used in the industry. The need for nondestructive evaluation is ubiquitous to ensure material quality. As an effective nondestructive testing method, ultrasound has great potential in providing an efficient materials characterization. However, contrary to more convenient ultrasound applications, challenges arise when applying ultrasound to 3D bi-material structures due to the coexistence of different phenomena, including diffraction effects caused by the periodicity. Two linear ultrasound methods, namely the Bragg diffraction and the comb filtering effect, are proposed to address this hurdle. The results show that the comb filtering effect effectively characterizes, respectively, the vertical structural quality of the bi-material. Bragg diffraction can also expose structural variations in the horizontal plane.
Key words: Ultrasound / Compressive strain / Periodic bi-material structure / Bragg Diffraction / Comb filtering effect
These two authors contributed equally to this work; Lynda Chehami is now with Université Polytechnique des Hauts de France, UPHF-INSA HdF, France
© I. Engel et al., Published by EDP Sciences, 2022
 This is an Open Access article distributed under the terms of the Creative Commons Attribution License (https://creativecommons.org/licenses/by/4.0), which permits unrestricted use, distribution, and reproduction in any medium, provided the original work is properly cited.
1 Introduction
Compared with conventional materials, the newly emerged materials with a regular microstructure, lattice structures, for example, can provide advantageous elastic properties, such as high stiffness to mass ratio. These structures are networks of small beams or shells assembled based on a three-dimensional primitive cell that repeats periodically in space. On a macroscopic scale, these microstructures can be used as a material constitutive for specific applications, requiring high performances in terms of stiffness-density ratio. They can also exhibit more original applications like materials with negative Poisson ratio [1, 2], or, acoustically speaking, exhibit band-gaps in their transmission spectra [3, 4].
With the rapid development of advanced manufacturing techniques such as 3D printing [5–7] and additive selective laser melting [8–10], the envisaged materials exhibit increasingly wide availability and consequently present great interest in aviation and automobile industries due to their performance, such as high resistance to bending. Furthermore, they also have great potential in medical applications [11–13], especially when combining a polymer with architectural titanium, which can provide high resistance to corrosion in addition to their superior mechanical performance.
From a mechanical point of view, it is vital to study the modes of failure when subjected to external loadings, such as compression and traction, before considering the lattice structures for industrial or medical applications. Therefore, an effective and reliable nondestructive testing or evaluation method [14–16] is essential.
After the emergence of modern ultrasound in the 1950s, ultrasonic acoustic waves became a powerful tool for the nondestructive evaluation of material’s integrity. Thanks to their relatively small wavelengths (<10 mm), the waves interact strongly with comparably sized defects, such as holes, cracks, or inclusions. Simultaneously, an inspection of large volumes of materials is possible thanks to practical applicability over adequate distances. At present, acoustic imaging techniques have taken an important place in various application fields, ranging from the medical domain and maritime [17, 18] to nondestructive testing and evaluation of materials [19].
The particular difficulty in investigating the microstructure of materials arises from their complexity, in contrast to homogeneous and regular composite materials. The complexity of the structures involves the coexistence of different phenomena, such as diffraction due to periodic inner structures, and nonlinear interactions [20] caused by adhesion properties between the beams (reinforcements) and the matrix (resin). The current work does not provide nonlinear acoustic results because the measurements, although revealing indications, did not provide conclusive quantifiable damage estimation results. Furthermore, attenuation may also play an important role, certainly in the interpretation of higher order frequencies caused by nonlinearities. We, therefore, propose an approach by linear ultrasound methods.
In a linear acoustic domain, diffraction and dispersion occur, but these effects may be accurately modeled and explained. In fact, the propagation of an arbitrary wave in a uniform medium may be seen as a collection of independently propagating plane waves, i.e. without power exchange. When the medium is periodic, however, the plane waves will be diffracted and dispersed. Due to the periodic character of the medium, there will be a specific coupling between certain plane waves of the set or between particular directions.
The remainder of this paper is organized in the following way. The sample preparation is described first, followed by a brief introduction to the mechanical compression tests to generate defects. The proposed ultrasound methods are then described, namely the ultrasonic Bragg diffraction and the comb filtering effect. Then, the results obtained from each method are described and discussed. Finally, conclusions summarize the work.
2 Materials and methods
2.1 Sample preparation
The sample tested in this study is a 3D periodic bi-material structure made of two polymers, i.e., acrylonitrile butadiene styrene (ABS) and epoxy, whose physical properties are listed in Table 1. The sample dimensions are 48 mm in length, 48 mm in width, and 33 mm in thickness, as shown in the top subfigure of Figure 1. The sample’s reinforcements (or beams) were made of ABS, using 3D printing, and were consequently embedded in an epoxy matrix using a gravity casting technique. The sample has two characteristic periodicities in the horizontal plane (XY plane): the diagonal (Λ1) and side (Λ2) of component cells, as shown in the bottom subfigure of Figure 1. Based on the measurements made on the image of the sample surface, Λ1 and Λ2 are approximately 3.96 mm and 2.81 mm, respectively.
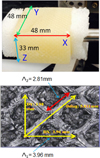 |
Figure 1 (Top) Photograph of the sample tested in this study and its dimensions. (Bottom) Image of the sample surface and the dimensions of a component cell. The image was obtained using a profilometer. |
Young’s modulus (E), mass density (ρ), and sound speed (c) of the constituent materials of the sample.
2.2 Compression tests for defect generation
The defects, to check the capability of ultrasound methods, were created by compressive loading using a universal testing machine (Zwick Roell), as in the top subfigure of Figure 2. Three compression tests were performed on the sample along the Z-axis (the thickness direction) with a maximum load of 65 kN. The maximum axial strains of these three tests are 7.5%, 22.5%, and 37.5%, respectively. The magnitude of the loads function of the displacement during a loading cycle for the tests with 7.5% and 22.5% strains are shown, as examples, in the bottom subfigure of Figure 2. During the compression tests, two major types of defects can be generated: (i) the structural degradation of the beams of the sample, which can occur in both horizontal plane (XY plane) and thickness direction (Z-axis), and (ii) the disconnection between the beams (ABS) and filling (epoxy).
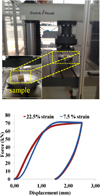 |
Figure 2 (Top) Photography of the compression machine. (Bottom) Examples of the force-displacement diagrams of the bi-material sample under compressive loading. |
2.3 Ultrasonic Bragg diffraction for measuring the characteristic periodicities in the horizontal plane of the 3D periodic sample
Diffraction of an acoustic beam from a periodically corrugated interface has been studied in several works [21–27]. In this type of diffraction phenomenon, the periodic surface corrugations work as a diffraction grating, and the periodicity of the corrugated surface is crucial to the diffraction pattern. When the incident beam impinges the corrugated surface, besides specular reflection, it will generate different orders of diffracted waves as described by
 (1)
(1)
where Λ is the periodicity, f is the frequency of the incident beam, V is the sound velocity in the medium of propagation and m (an integer) is the diffraction order. When the incident wave reaches a specific angle called “Bragg angle” (θBragg), as in the study of the X-ray diffraction in crystals [28] by William Laurence Bragg and William Henry Bragg, a diffracted beam will be scattered back to the beam source, in which incident angle (θi) and diffraction angles (θm) equal each other. They also equal the Bragg angle (θBragg). The Bragg angle at different diffraction orders (m) can be readily measured in a polar C-scan as shown in the top subfigure of Figure 3, and the periodicity of the grating surface can be obtained using this relationship
 (2)
(2)
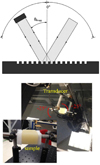 |
Figure 3 (Top) Schematic view of a polar scan for capturing backscattered waves at Bragg angles [26]. (Bottom) Photograph of the experimental setup of polar scan on the bi-material sample. |
In this study, the two periodicities in the 3D periodic bi-material sample’s horizontal plane will be estimated using equation (2). They are used for evaluating the structural integrity of the sample under compression.
Polar scans were performed over a range of ±25 degrees using a customer-designed ultrasound polar scanner (Inspection Technology Europe BV) as shown in the bottom subfigure of Figure 3 to measure the characteristic periodicities (Λ1 and Λ2 as in Fig. 1) of the sample. The scans were performed about two axes, i.e., the Y-axis and the diagonal axis, for measuring Λ1 and Λ2, respectively. A commercial immersion transducer (NDT System) with a center frequency of 1 MHz was chosen for the tests, operating in pulse-echo mode. Both the transducer and sample were immersed in a water tank during the scan.
Experimental data were acquired using “Winspect” software package at a sampling rate of 40 MHz and further processed using “Matlab”. The acquired data were initially expressed in the angle-time format. They then were converted to angular spectrograms (the angle-frequency format) through fast Fourier transformation in the time-domain of the data. The angle-frequency pairs of different diffraction fringes, which correspond to different diffraction orders, can be identified from the obtained angular spectrograms. Given the sound speed in water (1480 m/s), the characteristic periodicities of the sample can be calculated from equation (2).
To facilitate the process of acquiring angle-frequency data and avoid potential complexity in the spectrograms caused by an irregular beam, a transducer beam with a slight angle of divergence and a smooth spectrum is preferred. A polar scan was first performed on a smooth aluminum plate of 3 mm in thickness before testing the bi-material sample, to ensure the quality of the sound beam used in this work. The obtained angular spectrogram in Figure 4 shows that the beam of the 1 MHz transducer (i) is symmetric about 0 degree with an angle of divergence of about 10 degrees (−5 degree to +5 degree measured at 0.9 MHz with a threshold of 10 shown in the color bar of Figure 4), and (ii) has a relatively smooth energy distribution in the frequency domain. This spectrogram is also a reference for identifying diffraction fringes and reading their angle-frequency data.
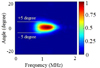 |
Figure 4 The normalized angular spectrogram was obtained from a polar scan on a smooth surface, indicating beam divergence measurement using the intensity of 10 (in the color bar) as a threshold. |
2.4 Ultrasonic comb filtering effect for measuring the vertical periodicity of the 3D periodic sample
The 3D periodic bi-material sample has three characteristic periodicities: horizontal ones (Λ1 and Λ2 as in Fig. 1) and vertical ones. The principle of Bragg diffraction can be used for characterizing the horizontal periodicities of the sample but cannot provide any quantitative evaluation of the vertical periodicity. In this section, we introduce a method based on a physical principle, the comb filtering effect [29–31], for measuring the vertical periodicity of the sample and further use it to analyze the effects of different strain levels on the vertical material integrity.
In pulsed ultrasonics, the comb filtering effect refers to the phenomenon in which the spectrum of the reflected or transmitted sound contains a series of peaks and/or dips, resulting in a comb-like spectrum. The cause of this phenomenon is the interference of the received (either in reflection or transmission) pulses with similar spectral coverage but different arrival times. These pulses are variations of the incident pulse generated during interaction with tested materials. For layered structures, the frequency difference (∆f) between the consecutive spectral tips or dips is related to the thickness of the layer (d) and the longitudinal velocity of the tested material (c) as in this relationship [29]:
 (3)
(3)
Thus, the thickness of layered structures can be measured through the comb filtering effect.
The 3D bi-material structure studied in this work is composed of cells, as shown in the bottom subfigure of Figure 1. The bi-material structure can be treated as a layered structure in the vertical direction (Z-axis in Fig. 1). Each layer consists of the component cells that theoretically have the same geometries and behaviors under uniform compression perpendicular to the layer. Thus, the vertical characteristic periodicity of the bi-material structure can potentially be estimated based on the comb filtering effect.
To investigate the material integrity in the vertical direction, we analyzed the specular reflections obtained from polar scans in Figure 3, which correspond to the backscattered signals obtained at 0 degrees. To show an example, the waveform and spectrum of the specular reflection obtained from the polar scan about the Y-axis, when the sample was experiencing 7.5% strain, are shown in Figure 5. In the spectrum of Figure 5, four sharp dips can be observed. Because at the locations of the first and third dips, similar dips appear for all the strain levels investigated in this study, the frequency interval ∆f was measured based on these two spectral dips for further analysis, and this frequency interval was obtained from both polar scans (about Y-axis and diagonal axis) under four different strain conditions. Since the maximum vertical strains (0%, 7.5%, 22.5%, and 37.5%) keep increasing in the four compression tests, the vertical deformation under these four maximum strain conditions is also expected to increase. So, the vertical thickness of the layers is expected to decrease.
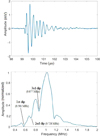 |
Figure 5 (Top) The waveform of the specular reflection along the Y-axis when the sample was under 7.5% strain. (Bottom) The normalized spectrum of the waveform is shown in the top subfigure. |
If the investigated bi-material structure is perfectly layered, the thickness measurements based on equation (3) should be the vertical (Z-axis) periodicity of the 3D periodic bi-material sample. However, there is a challenge that the sound speed in the bi-material structure is not constant (in contrast to a homogeneous material) since it is composed of two types of materials (ABS and epoxy), of which the sound speeds are different. According to the definition of longitudinal sound speed in a homogenous material
 (4)
(4)
and utilizing the Youngs modulus (E) and mass density (ρ) of the two constituent materials listed in Table 1, the sound speeds in ABS and epoxy are 1195 m/s and 1477 m/s, respectively. Although the sound speed in these two materials has a difference of about 20%, it is still reasonable to assume that it does not change when different levels of strain are applied because the bi-material constituents do not change.
To investigate the effect of compressive loadings on the vertical dimension of the bi-material structure, a characteristic parameter d/c is defined in equation (5):
 (5)
(5)
Since the velocity term (c) in this equation can be treated as a constant (although its value is unknown), d/c is proportional to the approximate round-trip time-of-flight in a layer of the bi-material structure (1/∆f), and, therefore, is proportional to the vertical dimension of the layers of the bi-material structure. Thus, this new variable can qualitatively indicate the vertical structural integrity of the tested bi-material sample. Based on equation (5), this newly defined vertical structural integrity indicator (d/c) can be obtained based on the measurement of frequency intervals from the comb filtering effect.
3 Results and discussion
In this section, the characteristic periodicities obtained in the horizontal plane of the sample (Λ1 and Λ2) are used to evaluate the effect of compressive strains on the horizontal material structures; the vertical structural integrity indicator (d/c) is used to evaluate the effect of the compression loading on the vertical structure of the sample.
3.1 Bragg diffraction and the effect of compressive strains on the bi-material structure in the horizontal plane
Polar scans were performed along two axes, i.e., the Y-axis and the diagonal axis as in Figure 1, under four compressive strain conditions (0%, 7.5%, 22.5%, and 37.5%). For example, the angular spectrograms obtained from the scans about the Y-axis without (0%) and with (37.5%) compression strains are shown in Figure 6.
 |
Figure 6 Normalized angular spectrograms were obtained in polar scans about the Y-axis for the sample under 0% and 37.5% strains. |
The middle signal corresponds to the specular reflection from the 3D periodic sample surface at the normal position (0 degrees) in each angular spectrogram. The other two signals correspond to the first order of diffracted beams at their corresponding Bragg angles. It can be observed that the spectrograms in the middle (0 degrees) of Figure 6 are similar to that in Figure 4. They all have the same angle of divergence (−5 degrees to + 5 degrees), and their peak frequencies are all about 1 MHz. These observations are reasonable because they all result from the perpendicular reflections of the polar scan. However, due to the material difference between Figure 4 (aluminum, homogenous) and Figure 6 (bi-material structure, inhomogeneous), their frequency coverages demonstrated a distinct difference. It can also be observed from Figure 6 that the diffraction fringes of the sample are different between the cases with and without applied strains. For example, the intensity of the diffraction fringes with 0% strain is higher than that with 37.5% strain. Since the periodicity of the sample mainly determines the location and shape of these angle-frequency fringes, this difference suggests that the periodicities in the horizontal plane of the sample may experience change during the application of compressive strains. It is important to distinguish more clearly the different fringes to focus only on the periodicity in the scan plane. For this reason, a normalized version of the spectrograms over the reference one, obtained on a flat surface as in Figure 4, is proposed. The resulting normalized angular spectrograms obtained from the polar scans about the Y-axis and diagonal axis are shown in Figure 7.
 |
Figure 7 Normalized angular spectrograms were obtained in polar scans about the (left column) Y-axis and (right column) diagonal axis for the sample under 0%, 7.5% and 37.5% strains. |
To estimate both cases’ periodicity, ten spots of Bragg angle-frequency pairs are extracted from each normalized angular spectrogram. For each angle-frequency fringe, the 10 angle-frequency pairs were read from the lower angle locations to the higher angle locations. This order is represented as the index of the angle-frequency pair in Figure 8. Each spot is the center of its representative fringe. The spot with the maximum intensity as its center is retained for each measurement. These pairs are the coordinates of the maximum intensity for each fringe. For each angle-frequency pair, Λ1 and Λ2 are then determined using equation (2). The obtained results are shown in Figure 8 for the first order (m = ±1) of Bragg diffraction under different strain levels.
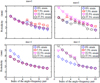 |
Figure 8 The determined horizontal periodicity, according to equation (2), of (left column) Λ1 and (right column) Λ2 based on the (top row) +1 order diffraction and (bottom row) −1 order of diffraction. |
It can be seen in Figure 8 that, for both cases, there is a fluctuation on the periodicity curves. However, as it is a 3D periodic structure, the estimated periodicity is not directly measured using a profilometer, i.e. Λ1 = 3.96 mm and Λ2 = 2.81 mm, but a value in between. For more accuracy, the periodicity is estimated by taking a weighted average over all the angle-frequency pairs for both cases,
 (6)
(6)
where N is the number of spots and Ai the corresponding intensity for the ith spot. Since 10 spots were chosen in this study to obtain Bragg angle-frequency pairs, N = 10 in equation (6). The results are summarized in Table 2.
Estimated horizontal periodicities (Λ1 and Λ2) in the horizontal plane of the bi-material sample for different strain levels.
Table 2 shows that the periodicity increases approximately 1.5 times the periodicity estimated in the healthy sample under small strain level values. However, when the strain level increases significantly, for example, around 37.5%, the periodicity is decreased. These results can be explained because the lateral periodicity is enlarged when the sample is under compression loading. However, when this load value reaches the critical level, the fibers may fail due to micro-cracks appearance. In this case, the filling factor (the number of periodicities per unit of area) decreases, inducing a de-filling factor (the number of periodicities per unit of area) decrease, and, therefore, inducing a decrease in this periodicity. In summary, based on these observations, the Bragg diffraction can be used to characterize early damage in this bi-material sample.
3.2 Comb filtering effect and the effect of compressive strains on the bi-material structure in the vertical direction
At each strain level, there are two perpendicular reflections (for an incident angle of 0 degrees) available for analysis, and they are from the polar scans about the Y-axis (for measuring Λ1) and diagonal axis (for measuring Λ2). The resultant measurements of the frequency intervals for all the four different strain levels are shown in the top subfigure of Figure 9. It can be readily observed that the frequency interval increases with the increase of strain levels, even if the values obtained from the scan about the Y-axis, are slightly higher than those obtained from the scan about the diagonal axis. Consequently, the vertical structural integrity indicator (d/c) decreases with increasing compressive strains.
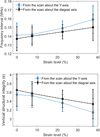 |
Figure 9 (Top) The frequency intervals were obtained from the comb filtering effect of the normal reflections during polar scans about the Y-axis and diagonal axis at four different strain levels. (Bottom) The vertical structural integrity indicator (d/c) is calculated from the top subfigure frequency intervals. |
Considering the condition that the sample’s sound velocities under different compressive loadings do not experience significant change, the d/c values can be treated as the scaled vertical periodicity of the sample. Then, the results in Figure 9 suggest that the vertical periodicity of the 3D periodic bi-material sample decreases as the sample experiences an increase in vertical strain, which is a reasonable conclusion because the thickness of the sample decreases with increasing compressive strains in this direction.
4 Conclusion
First, a 3D periodic bi-material structure based on ABS-epoxy polymers was fabricated in this study. Its responses to mechanical compression at different strain levels were tested using linear and nonlinear ultrasound methods. Two linear ultrasound methods, namely the Bragg diffraction method and the comb filtering effect method, were proposed to evaluate horizontal (perpendicular to compression) and vertical (parallel to compression) bi-material structural integrities and the results for both techniques are described in this work.
The results obtained using the Bragg diffraction method demonstrate a disturbance in the horizontal periodicities of the structure as the compressional strain increases. Furthermore, the measurements based on the comb filtering effect distinctively show a decrease in the structure’s vertical periodicity with increasing strain levels.
In summary, the comb filtering effect is proven effective in characterizing the vertical structural quality of the bi-material sample, while the Bragg diffraction phenomenon can reveal structural variations in the horizontal plane of the sample during the application of compressive strain.
Nonlinear acoustic effects may also be expected. Although using the method developed in S. Eckel et al. on composite materials [32], offered indications of nonlinear acoustic results caused by damage in the bi-material studied in this paper, the complexity of the obtained spectra did not permit conclusive quantitative results and would require further research, which is why the results were omitted from the paper.
These two authors contributed equally to this work; Lynda Chehami is now with Université Polytechnique des Hauts de France, UPHF-INSA HdF, France
Conflict of interest
The authors declare no conflict of interest.
Acknowledgments
This work is supported by the Conseil Régional de Grand Est, France.
References
- C.W. Huang, L. Chen: Negative Poisson’s ratio in modern functional materials. Advanced Materials 28, 37 (2016) 8079–8096. [CrossRef] [Google Scholar]
- R.S. Lakes: Negative-Poisson’s-ratio materials: auxetic solids. Annual Review of Materials Research 47 (2017) 63–81. [CrossRef] [Google Scholar]
- B.L. Hao, P.K. Liu, C.J. Tang: The two-dimensional metal photonic band gap structure consisting of a skew lattice in a nonorthogonal coordinate system. Acta Physica Sinica – Ch Ed 55, 4 (2006) 1862–1867. [CrossRef] [Google Scholar]
- V. Kuzmiak, A.A. Maradudin, A.R. McGurn: Photonic band structures of two-dimensional systems fabricated from rods of a cubic polar crystal. Physical Review B 55, 7 (1997) 4298–4311. [CrossRef] [Google Scholar]
- L.K. Johnson, C. Richburg, M. Lew, W.R. Ledoux, P.M. Aubin, E. Rornbokas: 3D Printed lattice microstructures to mimic soft biological materials. Bioinspiration & Biomimetics 13, 6 (2018) 1–9. [Google Scholar]
- H. Li, Y.S. Liu, Y.S. Liu, Q.F. Zeng, J.J. Liang: Microstructure and mechanical properties of 3D printed ceramics with different vinyl acetate contents. Rare Metals (2021). [Google Scholar]
- H.S. Yang, W.W. Li, Y.J. Che: 3D printing cementitious materials containing Nano-CaCO3: workability, strength, and microstructure. Frontiers in Materials 7 (2020) 260. [CrossRef] [Google Scholar]
- X.P. Liu, K.S. Wang, P. Hu, X.M. He, B.C. Yan, X.Z. Zhao: Formability, microstructure and properties of inconel 718 superalloy fabricated by selective laser melting additive manufacture technology. Materials 14, 4 (2021) 991. [CrossRef] [PubMed] [Google Scholar]
- H. Chen, X.H. Zi, Y. Han, J. Dong, S.C. Liu, C. Chen: Microstructure and mechanical properties of additive manufactured W-Ni-Fe-Co composite produced by selective laser melting. International Journal of Refractory Metals and Hard Materials 86 (2020) 1–8. [Google Scholar]
- M. Guo, D.D. Gu, L.X. Xi, H.M. Zhang, J.Y. Zhang, J.K. Yang, R. Wang: Selective laser melting additive manufacturing of pure tungsten: Role of volumetric energy density on densification, microstructure and mechanical properties. International Journal of Refractory Metals and Hard Materials 84, 105025 (2019) 1–11. [Google Scholar]
- A.J. Guerra, H. Lara-Padilla, M.L. Becker, C.A. Rodriguez, D. Dean: Photopolymerizable resins for 3D-printing solid-cured tissue engineered implants. Current Drug Targets 20, 8 (2019) 823–838. [CrossRef] [PubMed] [Google Scholar]
- A. Haleem, M. Javaid: Polyether ether ketone (PEEK) and its 3D printed implants applications in medical field: An overview. Clinical Epidemiology and Global Health 7, 4 (2019) 571–577. [CrossRef] [Google Scholar]
- R. Velu, T. Calais, A. Jayakumar, F. Raspall: A comprehensive review on bio-nanomaterials for medical implants and feasibility studies on fabrication of such implants by additive manufacturing technique. Materials 13, 1 (2020) 1–23. [Google Scholar]
- M. Lints, A. Salupere, S. Dos Santos: Simulation of solitary wave propagation in carbon fibre reinforced polymer. Proceedings of the Estonian Academy of Sciences 64, 3 (2015) 297–303. [CrossRef] [Google Scholar]
- S. Chen, W.X. Hu, C.H. Wang, C.C. Hao, Z. Xu, Y.H. Zhang, S.Y. Lin: Enhancement of backward second harmonic generation of acoustic waves in a resonant cavity by using a superlattice. Ultrasonics 73 (2017) 107–113. [CrossRef] [PubMed] [Google Scholar]
- A.M. Samsonov, I.V. Semenova, F.E. Garbuzov: Nonlinear guided bulk waves in heterogeneous elastic structural elements. International Journal of Non-Linear Mechanics.94 (2017) 343–350. [CrossRef] [Google Scholar]
- T. Druet, B. Chapuis, M. Jules, G. Laffont, E. Moulin: Passive guided waves measurements using fiber Bragg gratings sensors. Journal of the Acoustical Society of America 144, 3 (2018) 1198–1202. [CrossRef] [PubMed] [Google Scholar]
- M. Siderius, J. Li, P. Gerstoft: Head waves in ocean acoustic ambient noise: Measurements and modeling. Journal of the Acoustical Society of America 143, 2 (2018) 1182–1193. [CrossRef] [PubMed] [Google Scholar]
- L. Chehami, E. Moulin, J. de Rosny, C. Prada, O.B. Matar, F. Benmeddour, J. Assaad: Detection and localization of a defect in a reverberant plate using acoustic field correlation. Journal of Applied Physics 115, 10 (2014) 104901. [CrossRef] [Google Scholar]
- N. Jiménez, F. Camarena, N. González-Salido: Dynamic nonlinear focal shift in amplitude modulated moderately focused acoustic beams. Ultrasonics 75 (2017) 106–114. [CrossRef] [PubMed] [Google Scholar]
- S.W. Herbison, J.M. Vander Weide, N.F. Declercq: Observation of ultrasonic backward beam displacement in transmission through a solid having superimposed periodicity. Applied Physics Letters 97, 4 (2010) 041908. [CrossRef] [Google Scholar]
- N.F. Declercq, C.S.A. Dekeyser: Acoustic diffraction effects at the Hellenistic amphitheater of Epidaurus: Seat rows responsible for the marvelous acoustics. Journal of the Acoustical Society of America 121, 4 (2007) 2011–2022. [CrossRef] [PubMed] [Google Scholar]
- J.F. Liu, N.F. Declercq: Acoustic Wood anomaly in transmitted diffraction field. Journal of Applied Physics 121, 11 (2017) 114902. [CrossRef] [Google Scholar]
- J.F. Liu, N.F. Declercq: A secondary diffraction effect and the generation of Scholte-Stoneley acoustic wave on periodically corrugated surface. Journal of Applied Physics 119, 17 (2016) 174901. [CrossRef] [Google Scholar]
- J.F. Liu, N.F. Declercq: Investigation of the origin of acoustic Wood anomaly. Journal of the Acoustical Society of America 138, 2 (2015) 1168–1179. [CrossRef] [PubMed] [Google Scholar]
- J.F. Liu, N.F. Declercq: Experimental observation of acoustic sub-harmonic diffraction by a grating. Journal of Applied Physics 115, 24 (2014) 244902. [CrossRef] [Google Scholar]
- J.F. Liu, N.F. Declercq: Air-coupled ultrasonic investigation of stacked cylindrical rods. Journal of the Acoustical Society of America 131, 6 (2012) 4500–4507. [CrossRef] [PubMed] [Google Scholar]
- W.L. Bragg, J.J. Thomson: The diffraction of short electromagnetic waves by a crystal. Proceedings of the Cambridge Philosophical Society 17 (1914) 43–57. [Google Scholar]
- J.F. Liu, N.F. Declercq: Pulsed ultrasonic comb filtering effect and its applications in the measurement of sound velocity and thickness of thin plates. Ultrasonics 75 (2017) 199–208. [CrossRef] [PubMed] [Google Scholar]
- A. Todo, H. Sawada, IEEE, Estimation of musical pitch by using comb filters for the identification of musical instruments, in: Annual Conference on the Society-of-Instrument-and-Control-Engineers, Kagawa University, Takamatsu, Japan, 2007, pp. 657–660. [Google Scholar]
- L. Remaggi, P.J.B. Jackson, W.W. Wang: Modeling the comb filter effect and interaural coherence for binaural source separation, IEEE – ACM Transactions on Audio Speech and Language Processing 27, 12 (2019) 2263–2277. [Google Scholar]
- S. Eckel, F. Meraghni, P. Pomarede, N.F. Declercq: Investigation of damage in composites using nondestructive nonlinear acoustic spectroscopy. Experimental Mechanics 57, 2 (2017) 207–217. [CrossRef] [Google Scholar]
Cite this article as: Chehami L. Liu J. Pomarède P. Lohmuller P. Pittrowski B, et al. 2022. Ultrasonic investigation of the effect of compressive strains on 3D periodic bi-material structures. Acta Acustica, 6, 26.
All Tables
Young’s modulus (E), mass density (ρ), and sound speed (c) of the constituent materials of the sample.
Estimated horizontal periodicities (Λ1 and Λ2) in the horizontal plane of the bi-material sample for different strain levels.
All Figures
|
Figure 1 (Top) Photograph of the sample tested in this study and its dimensions. (Bottom) Image of the sample surface and the dimensions of a component cell. The image was obtained using a profilometer. |
| In the text | |
|
Figure 2 (Top) Photography of the compression machine. (Bottom) Examples of the force-displacement diagrams of the bi-material sample under compressive loading. |
| In the text | |
|
Figure 3 (Top) Schematic view of a polar scan for capturing backscattered waves at Bragg angles [26]. (Bottom) Photograph of the experimental setup of polar scan on the bi-material sample. |
| In the text | |
|
Figure 4 The normalized angular spectrogram was obtained from a polar scan on a smooth surface, indicating beam divergence measurement using the intensity of 10 (in the color bar) as a threshold. |
| In the text | |
|
Figure 5 (Top) The waveform of the specular reflection along the Y-axis when the sample was under 7.5% strain. (Bottom) The normalized spectrum of the waveform is shown in the top subfigure. |
| In the text | |
|
Figure 6 Normalized angular spectrograms were obtained in polar scans about the Y-axis for the sample under 0% and 37.5% strains. |
| In the text | |
|
Figure 7 Normalized angular spectrograms were obtained in polar scans about the (left column) Y-axis and (right column) diagonal axis for the sample under 0%, 7.5% and 37.5% strains. |
| In the text | |
|
Figure 8 The determined horizontal periodicity, according to equation (2), of (left column) Λ1 and (right column) Λ2 based on the (top row) +1 order diffraction and (bottom row) −1 order of diffraction. |
| In the text | |
|
Figure 9 (Top) The frequency intervals were obtained from the comb filtering effect of the normal reflections during polar scans about the Y-axis and diagonal axis at four different strain levels. (Bottom) The vertical structural integrity indicator (d/c) is calculated from the top subfigure frequency intervals. |
| In the text | |
Current usage metrics show cumulative count of Article Views (full-text article views including HTML views, PDF and ePub downloads, according to the available data) and Abstracts Views on Vision4Press platform.
Data correspond to usage on the plateform after 2015. The current usage metrics is available 48-96 hours after online publication and is updated daily on week days.
Initial download of the metrics may take a while.