Open Access
Figure 9
Download original image
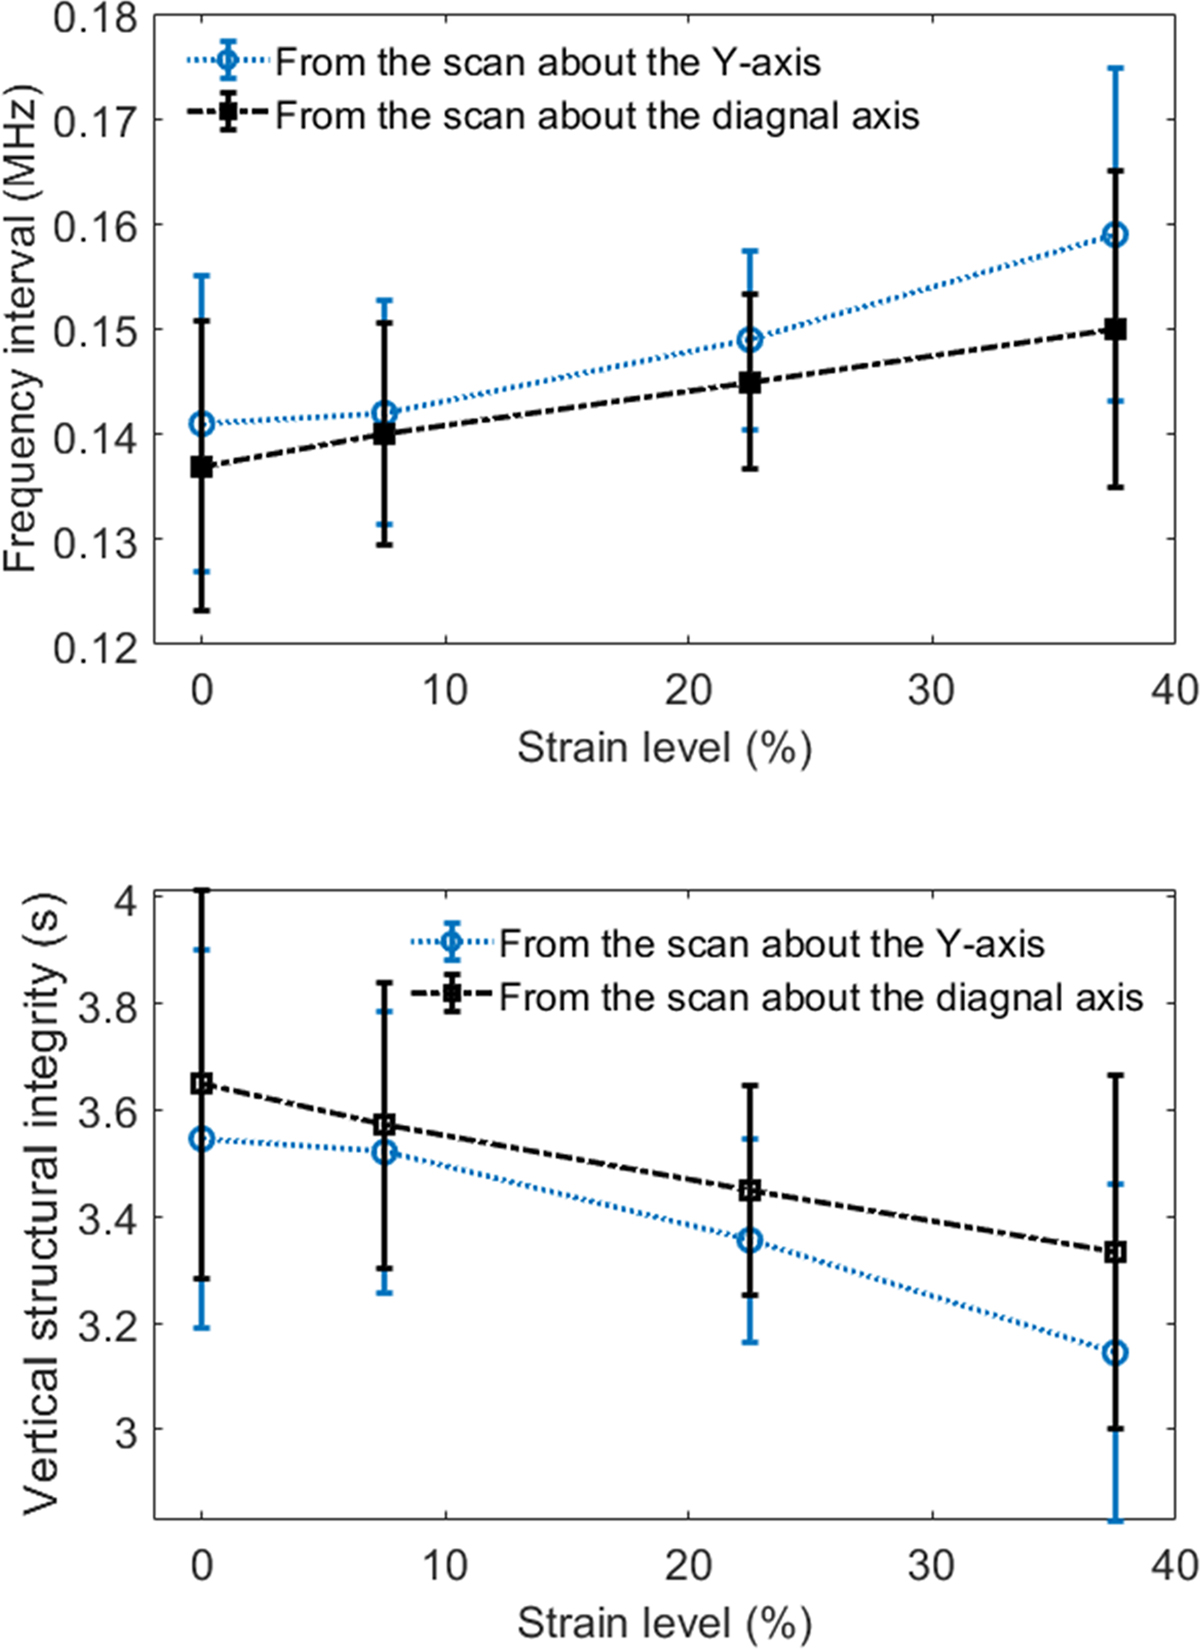
(Top) The frequency intervals were obtained from the comb filtering effect of the normal reflections during polar scans about the Y-axis and diagonal axis at four different strain levels. (Bottom) The vertical structural integrity indicator (d/c) is calculated from the top subfigure frequency intervals.
Current usage metrics show cumulative count of Article Views (full-text article views including HTML views, PDF and ePub downloads, according to the available data) and Abstracts Views on Vision4Press platform.
Data correspond to usage on the plateform after 2015. The current usage metrics is available 48-96 hours after online publication and is updated daily on week days.
Initial download of the metrics may take a while.