| Issue |
Acta Acust.
Volume 6, 2022
Topical Issue - Aeroacoustics: state of art and future trends
|
|
|---|---|---|
| Article Number | 48 | |
| Number of page(s) | 12 | |
| DOI | https://doi.org/10.1051/aacus/2022043 | |
| Published online | 25 October 2022 | |
Scientific Article
Aerodynamic and aeroacoustic properties of axial fan blades with slitted leading edges
1
Aalen University of Applied Sciences, Institute for Virtual Product Development, Beethovenstr. 1, 73430 Aalen, Germany
2
Friedrich-Alexander University Erlangen-Nuremberg, Institute for Fluid Mechanics, Cauerstr. 4, 91058 Erlangen, Germany
3
University of Southampton, Institute of Sound and Vibration Research, University Road, Southampton SO17 1BJ, UK
4
Aalen University of Applied Sciences, Mechanical Engineering and Materials Science, Beethovenstr. 1, 73430 Aalen, Germany
* Corresponding author: This email address is being protected from spambots. You need JavaScript enabled to view it.
Received:
3
March
2022
Accepted:
26
September
2022
Abstract
A detailed experimental analysis of the aerodynamic and aeroacoustic properties of flat-plate axial fans with slitted leading edges is performed. The sound emissions of five slitted leading edge designs are measured at a constant rotational speed and at a constant total-to-static pressure rise of the fans. For both cases, the fan blades with slitted leading edges reduce the turbulence interaction noise and lead to a reduction of the overall sound pressure level for volume flow rates above 0.6 m3 s−1 compared to an axial fan with solid leading edges. The far-field noise analysis shows that the slits result in a noise reduction for frequencies below 2 kHz and a noise increase above 2 kHz. In addition, sound source localization is conducted with a microphone array and rotating beamforming methods are applied. The identified sound source distributions prove that slitted leading edges reduce turbulence interaction noise, but generate broadband noise in the fan blades’ trailing edge regions. The maximum sound reduction due to the slits could be detected at a dimensionless frequency of  , where f is the frequency, h is the height of the slit and
  is the mean relative inflow velocity. The noise reduction mechanism on axial fan blades corresponds well to previous investigations on flat-plate airfoils with slits.
Key words: Slitted leading edges / Turbulence interaction noise / Noise reduction / Microphone array / Rotating beamforming / Axial fan
© The Author(s), Published by EDP Sciences, 2022
 This is an Open Access article distributed under the terms of the Creative Commons Attribution License (https://creativecommons.org/licenses/by/4.0), which permits unrestricted use, distribution, and reproduction in any medium, provided the original work is properly cited.
1 Introduction
Ventilation systems are essential for creating a healthy indoor climate in living and working spaces. In addition to air conditioning, the elimination of aerosols and air pollution control, criteria of minimal noise pollution must also be met to fulfill legal requirements and health standards. In this way, the acceptance of the systems in the user’s environment can be ensured. The axial fans used in these ventilation systems are among the system components with the highest noise emission. A dominant source of noise from axial fans is turbulence interaction noise, which is generated by the interaction of the leading edges of the fan blades with the turbulence of the incoming flow, especially when the axial fans are located behind a heat exchanger, a filter, or a protective device (see, for example, [1, 2]). With the aim of reducing turbulence interaction noise, different leading-edge modifications have been developed that affect the aerodynamic and aeroacoustic properties of axial fans. Leading-edge treatment approaches to reduce turbulence interaction noise for axial fans include leading-edge serrations [3–8], flow-permeable materials [9–11] or modifications of the blade shape in the form of sweeping or skewing [12–17]. The approach followed in this work is based on preliminary wind tunnel investigations on slitted flat-plate airfoils [18, 19]. The physical sound reduction mechanism of the slitted leading edge there is related to a phase interference and destruction effect of the surface pressure fluctuations, which arises from two sources at both ends of the slit at fh/u ≈ (2n − 1)/2, where n = 1, 2, 3, … f is the source frequency, h is the total height of the slit and u is the relative inflow velocity. Previous experimental [18, 19] and numerical [20] investigations have confirmed the hypothesis that the noise reduction mechanisms for slitted leading edges on flat plates are related to an overall reduction in source strength through the interference between two sources at either ends of the slit. The ratio of hydrodynamic wavelength u/f to the slit height h is the critical non-dimensional factor which govern the peak noise reductions. The two sources differ by a phase (ϕ = ωh/u) as the sources are separated in the streamwise direction by a distance h. Maximum noise reductions are achieved at a frequency at which the two sources are located on either end of the slit radiate 180° out of phase. In addition to relatively simple slits at the leading edge of airfoils, slits were also used in combination with sinusoidal leading edges or serrated leading edges. In this case, the roots of the serrations were additionally extended with the slits. It was found that slits in combination with serrations achieved the best noise reduction at a relative slit width of w/λ = 0.133, where λ is the wavelength of the serrations [18, 21]. For the relative slit spacing d/w in relation to the width of the slits, the best sound reduction was found for a value of 6.72. For the dependence of the sound reduction on the slit height, it was observed that with increasing height h the sound reduction increases [19]. The increased sound reduction may be a result from an increased cross-flow between pressure and suction side. However, this cross-flow would also decrease the aerodynamic performance of the flat-plate airfoil. Unfortunately, the aerodynamic properties of the flat-plate airfoils have not been analyzed in the work of Chaitanya et al. [19]. Czwielong et al. [22] applied the slits to profiled axial fans to reduce the leading edge noise of the fan in heat exchanger systems. It was shown that slits in their application lead to better sound reduction than serrated leading edges, but also reduce the pressure rise of the fan.
Based on the investigations on flat-plate airfoils in the wind tunnel, fan blades with slitted leading edges are analyzed in this work for different operating points in terms of their aerodynamic and aeroacoustic properties. Further, measurements with a microphone array are conducted and a rotating beamforming method is applied for sound source localization. The underlying mechanisms of noise generation may differ from those observed at flat-plate airfoils since the prevailing velocity components are different due to the rotation and the turbulence in rotating systems is most as likely not ideally homogeneous and isotropic as in a wind tunnel study [14, 15, 23]. In addition, axial fan effects such as tip-leakage flow, rotating stall, transient blade forces, flows in radial direction and tonal aspects due to the blade passing frequency occur for different inflow turbulence and operating points. This makes a transfer of noise reduction techniques from flat-plate airfoils to a rotating fan challenging.
2 Slitted fan blades and test setup
For the investigations, simplified flat-plate fans, which are often used in low-cost fan products, are equipped with different slit designs at their leading edges. The effects of the slits on the aerodynamics and aeroacoustic properties of the fans are investigated using a standardized axial fan test rig. In this test rig, turbulent inflow conditions are generated by rigid turbulence grids. The increased inflow turbulence in turn interacts with the leading edge of the fans, creating an amplified sound source in the low frequency range. This increased sound source is intended to be reduced by the leading edge slits.
2.1 Fan blade designs
In order to transfer the noise reduction mechanism of a slitted leading edge on flat-plate airfoils as accurately as possible into a rotating system, the investigated fan blades were laser cut from an aluminum plate with a constant thickness of 6 mm. Each fan consists of nine forward-skewed fan blades. The blade skew is a combination of a blade sweep λ and a blade dihedral ν [15]. For low-pressure axial fans, forward-skewed fan blades are already acoustically optimized compared to backward-skewed and unskewed fan blades. This optimized blade skew has also been confirmed on the flat-plate fans used [6, 16]. The sweep angle increases linearly along the fan blade span from λ = 0° at the hub to λ = 55° at the tip and the dihedral angle is 0° due to the flat-plate blade geometry. Further, basic fan design parameters are listed in Table 1.
Fan design parameters and operating point.
In total, six fans are investigated, one reference fan without slits and five fans with slitted leading edges. The geometry of the slits is defined by the slit height h, the slit width w and the slit spacing d. The slit height was kept constant at h = 22.5 mm and the slit width and slit spacing were varied. The slit height in relation to the mean chord length of the fan blades has a value of  . For the relative value of 33%, the best sound reduction properties were already found on flat-plate airfoils in wind tunnel tests [19]. For example, the fan h22_5_w2_d15 has a slit height h = 22.5 mm, a slit width w = 2 mm and a distance between the slits of d = 15 mm (Fig. 1b).
 |
Figure 1 (a) Reference fan and (b) fan h22_5_w2_d15 with slitted leading edges. |
The design parameters of the slits at the leading edge of the axial fan can be illustrated by means of Figure 2. The slits are arranged along the radius of the fan, i.e., along the span position. It has been found that the incident flow velocity is related to the achieved sound reduction and the position of the maximum sound reduction in the frequency domain. For axial fans the velocity triangles are valid [24], which are composed of the circumferential velocity of the fan, the absolute velocity and the velocity in the relative system of the fan. The relative velocity to the fan blade represents the velocity corresponding to the incident velocity on the rigid airfoil. According to the blade element theory [15], the axial fan was divided into ten segments, in which the relative velocity was determined. The mean value of the relative velocity was then calculated using equation (1). Here, the index i = 1 indicates the fan section at the hub and the index i = 10 at the blade tip. At the design point ( m s−1), the averaged relative velocity over the whole entrance of the fan blade is
  m s−1:
 (1)
(1)
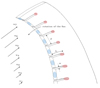 |
Figure 2 Schematic of a fan blade with the relative velocity wi changing over the span. The areas in which the dominant sound sources are located are marked in blue and red. The design parameters slit width w, slit spacing d and slit height h are shown. The sound sources between leading edge and slit root are separated from each other by the slit height h. |
The geometrical variants of the investigated fans are shown in Table 2. These variants were chosen to investigate the scaling of the slits, the impact of the slit width and the slit spacing for different operating points.
2.2 Experimental setup
The aerodynamic performance and the noise emission of the axial fans were measured in the axial test bench at the Friedrich-Alexander University Erlangen-Nuremberg [15, 25]. The inflow turbulence necessary for the investigation of turbulence interaction noise was generated by a turbulence grid, which was mounted 65 mm upstream of the axial fans in a short duct. The turbulence grid has a mesh width of 24 mm, a bar width of 4 mm [23] and generates disturbed inflow conditions with a mean turbulence intensity of  and a mean integral length scale of
  . The flow field downstream of the turbulence grid was investigated using 3D hot-wire anemometry (Dantec Dynamics). For these measurements, the fan was replaced by a bladeless hub body [26].
The aerodynamic and aeroacoustic properties of the fans were measured for different operating points. To evaluate the aerodynamic performance of the fans, the total-to-static pressure difference, i.e., the pressure increase between the measurement chamber and the ambient environment, is compared with each other as a function of the volume flow rate. Therefore, the volume flow rate, the total-to-static pressure difference, the rotational speed and the shaft torque were measured for a time of tm = 15 s and a sampling frequency of fs = 1 kHz. To characterize the sound field, first, seven 1/2th inch free-field microphones from Brüel & Kjær were positioned on a horizontal semicircle with a radius of r = 1 m around the bellmouth at the same height as the fan rotational axis (Fig. 3a). The sound pressure was measured for a time of tm = 30 s with a sampling frequency of fs = 48 kHz and the overall sound pressure level (SPL) was determined from the averaged spectrum for the frequency range f ∈ [0.1 kHz; 10 kHz]. This experimental setup is typically used to determine the far-field noise emission of axial fans. In order to obtain additional information about the pressure fluctuations on the inner duct wall and in the tip gap of the fan, the duct used is equipped with 15 pressure sensors (XCs-093-1psi D kulite) along a line from the suction side of the fan to the pressure side. The sensors are installed flush with the duct wall and can thus measure the pressure fluctuations on the duct wall [15]. In addition, acoustic measurements were performed using a planar microphone array, consisting of 64 1/4th inch microphones of the type 40PH-Sx (G.R.A.S. Sound and Vibration A/S) mounted on a ring-shaped array with a diameter of darray = 1.8 m (Fig. 3b). The measurement distance from the fan and the microphone array was z = 0.81 m. Rotating beamforming is applied for sound source localization to present the benefit compared to the conventional experimental setup with seven microphones [27, 28].
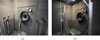 |
Figure 3 (a) Conventional far-field noise measurement setup for axial fans and (b) microphone array measurement setup. |
3 Results
The axial fans were measured first at a constant rotational speed of fR = 24.8 Hz. Then, the rotational speed of each fan was adapted to obtain the same total-to-static pressure rise for all fans at a specific operating point. Finally, the axial fans were measured with a microphone array for sound source localization and to connect the sound source distribution to the noise generation mechanisms.
3.1 Aeroacoustic properties at constant rotational speed
Considering a constant rotational speed for all fans, the total-to-static pressure difference of the fans with slitted leading edges decreases for all operating points considered (Fig. 4a). This difference could be due to the fact that the slits cut into the fan blades also reduce the fan blade area at the leading edge. Even though the reduced area only takes up a small part of the total blade area, it still reduces the pressure rise of the fan. At the same time, the slits cause a sound level reduction of up to 7 dB (Fig. 4b). The fan h22_5_w2_d10 has the most efficient noise reduction over a broad volume flow range, but it also has the highest aerodynamic penalty. This means that any reduction in the sound level must be weighed against a deterioration in the aerodynamic performance (Section 3.3). Further, the acoustical optimum is shifted from a volume flow rate  1.1 m3 s−1 for the reference fan to
  0.9 m3 s−1 for the fans with slitted leading edges.
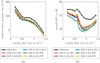 |
Figure 4 Characteristic curves for the reference fan and the fans with slitted leading edges. (a) Aerodynamic curves, (b) overall sound pressure levels. |
An evaluation of the sound pressure spectra for the design point of the reference fan ( 1.1 m3 s−1) shows that the sound pressure level is reduced by the slitted leading edge for frequencies below 2 kHz (Fig. 5). The broadband noise reduction could be related to a reduced turbulence interaction noise at the leading edge of the fan blade. Further, a weakened tip gap vortex may be generated due to a reduced pressure difference between the suction side and pressure side. The flow through the slits locally reduces the pressure difference at the blade and thus decreases the strength of the tip gap vortex. In addition, tonal components related to the blade passing frequency and its harmonics are reduced by the slits. Tonal sound sources are often generated by fluctuating blade forces, which lead to unsteady loading noise [15, 29]. Similar to the observations on leading edge serrations, slits may reduce the tonal components by reducing the unsteady blade forces [30]. Above 2 kHz, however, the sound pressure level is increased compared to the reference fan. High-frequency noise is assumed to be due to the thickening of the turbulent boundary layer by the slits at the leading edge and the interaction with the trailing edge.
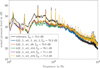 |
Figure 5 Sound pressure spectra for a volume flow rate |

Finally, a reduction of the total sound pressure level  up to 3.4 dB is observed at the design point for the fans with slitted leading edges in comparison to the reference fan. Further, it should be kept in mind that for frequencies up to 2 kHz the noise reduction is very effective from a psychoacoustic point of view.
In addition to the far field, the analysis of the wall-pressure fluctuations in the duct provides additional information that is useful for the interpretation of the acoustic effects of the slitted fans. Figure 6 shows the linear pressure spectra of the second pressure sensor on the suction side of the fan. These show similar characteristics to the acoustic far field. It can be seen that a broadband reduction up to 2 kHz is present due to the slits. This indicates that the pressure fluctuations at the leading edge of the fan in the vicinity of the pressure sensor have been reduced by the slits. This reduction must take place partially in the area of the tip gap so that this can be detected by the wall-flush pressure sensors. The same tendencies in the pressure spectrum can be observed for the other pressure sensors on the suction side and in the tip gap of the axial fans. This indicates that not only the leading edge noise alone can be reduced due to the slits, but that the vortex system which forms in the tip gap of the fans is weakened by the interaction of the flow with the slits.
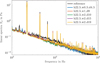 |
Figure 6 Wall-pressure fluctuations on the suction side of the fan. |
3.2 Sound pressure reduction and correlations to stationary flat-plate airfoils
In the literature [18, 19, 31] on slits in flat-plate airfoils, which were investigated with respect to their acoustic properties in wind tunnels, it was found that the slits exhibit a peak sound power reduction at fh/u ≈ (2n − 1)/2, where n = 1, 2, 3, … . In order to investigate the validity of this relationship on rotating axial fan blades, the difference one-third octave band spectra of the slitted fans in relation to the reference fan are shown in Figure 7. A positive value indicates a sound reduction compared to the reference fan. In this case, the spectrum is not displayed as a function of frequency but by the dimensionless ratio  derived from the flat-plate airfoil investigations. This representation was chosen according to the literature [19]. For the axial fan, the relative velocity in the rotating reference system represents the incident flow velocity on the leading edge of the blade, so in this case for the fan application the incident flow velocity u from the wind tunnel investigations was replaced by the mean relative flow velocity
  on the axial fan blade. The relative velocity varies over the radius of the axial fan, which is why in this case the mean relative velocity over the whole axial fan blade is referred to. At the design point, the mean relative velocity is
  m s−1. In Figure 7, a hump in the sound reduction can be seen for all slitted fans. This has its maximum at
  (f = 673 Hz). This indicates that the relationship between the maximum in the sound reduction and the slit parameters as well as the flow velocity, which has already been derived for rigid plates, can also be found in a good approximation for rotating flat-plate fans. The second hump at
  (f = 2020 Hz) could not be identified here because the noise of the trailing edge already dominates the interaction noise of the leading edge. This increase in trailing edge noise has been further explored using rotating beamforming in Section 3.4.
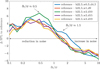 |
Figure 7 Difference one-third octave band spectra from the slitted axial fans to the reference fan as a function of the dimensionless frequency. |
In addition to the position of the maximum sound reduction, a correlation between the maximum sound reduction and the ratio of slit spacing and slit width d/w was determined for flat-plate airfoils in literature [19]. Thus, depending on the slit width, a respective optimal ratio of d/w could be derived. For the slit widths of 0.5 mm, 1 mm and 2 mm selected for the fans, optimum d/w ratios in the range of approximately 6.5–7.5 should be found based on the flat-plate investigations [19]. In contrast to the airfoil studies in the literature, the greatest sound reduction can be found with the fan h_22_5_w_d10, which has a small ratio of d/w = 5. The fans with a slit width of w = 2 starting to generate more sound emissions compared to the reference fan for the dimensionless frequency of  . The generation of high-frequency sound increases with decreasing distance between the slits d or with decreasing ratio d/w. This indicates that a higher number of slits results in higher sound radiation at high
  , i.e., at high frequencies. In addition, the limit
  , at which sound reduction changes to sound increase, shifts to higher values of
  as the slit width w decreases. This means that with a smaller slit width, the frequency range in which sound attenuation takes place can be increased compared to the reference fan. This observation is also consistent with [19], where smaller slit width are desirable to generate smaller increase in high-frequency noise.
3.3 Aeroacoustic behavior at a constant pressure rise
To compare the sound level reduction of the slitted fans to the reference fan at a similar total-to-static pressure rise, the rotational speed of the individual fans were adapted. In real applications, the operating point of the fans is often defined by the system, i.e., by the pressure loss present. The required volume flow is achieved by controlling the speed of the fans. For this reason, it is important to compare the fans at the same operating point in order to obtain a better reference to the sound emission of the fans in real systems. Since the fan h22_5_w2_d10 has the lowest pressure rise for a constant rotational speed, the rotational speed of the other fans were reduced to obtain a similar total-to-static pressure rise as the fan h22_5_w2_d10 (Fig. 8a). The aerodynamic characteristics curve of the fans are not shown here in this case because they are identical to the curve of h22_5_w2_d10 from Figure 4a for all fans. It must be noted that the flow separation in the partial load range is influenced by the changed rotational speed and, due to the associated change in Reynolds number, a comparison in this operating range must be viewed with caution with regard to the sound radiation. For low volume flow rates up to  0.4 m3 s−1, the sound pressure levels of the fans with a slit width of w = 2 mm are higher compared to the reference fan and the fans with smaller slit widths. Above
  0.4 m3 s−1, the fans with slitted leading edges still have a lower sound radiation up to 2.3 dB compared to the reference fan, although, the pressure rise is similar (Fig. 8b). In contrast to the measurements at a constant rotational speed, the operating point with the acoustic optimum is the same for the reference fan and the fans with slitted blades (
 0.8 m3 s−1).
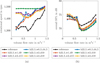 |
Figure 8 (a) Rotational speed and (b) overall sound pressure level as a function of the volume flow rate for the reference fan and the fans with slitted leading edges at a constant pressure rise. |
Due to the different rotational speeds of the fans, the tonal components in the sound pressure spectra are shifted in frequency (Fig. 9). The sound pressure spectra are plotted for a volume flow rate of  1.1 m3 s−1. Due to the adaption of the rotational speed, the reference fan and the modified fans are now operating at a off-design point. Nevertheless, the sound pressure spectra for the other operating points are comparable. Again, a broadband noise reduction is obtained for the slitted fan blades for frequencies below 2 kHz. Above 2 kHz, the reference fan has the lowest sound pressure levels. The tonal components due to the blade passing frequency are higher for the reference fan up to the third harmonic. The sound pressure level for higher harmonics is lower for the reference fan compared to the slitted fan blades. This has also been observed for the measurements at a constant rotational speed (Fig. 5).
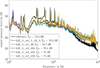 |
Figure 9 Sound pressure spectra for a volume flow rate |

The identification of the physical mechanisms and the extent to which each of the mechanisms contributes to the total noise generation cannot be completely resolved with this experimental setup. Additional flow field measurements, e.g., laser Doppler anemometer measurements, particle image velocimetry or wall pressure fluctuations on the blade surface, are needed to predict the sound field. In addition, a numerical analysis based on computational fluid dynamics in combination with acoustic analogy models [32] or solving the acoustic perturbation equations [33] is another suitable method to identify the physical mechanisms. The identification of the sound source distribution is still not easily available.
3.4 Sound source localization
Microphone array techniques combined with rotating beamforming methods provide an opportunity to understand the noise generation mechanisms in more detail because the sound source distribution is determined directly from the acoustic measurement. The sound source distribution can be better attributed to specific flow phenomena, which in turn helps to develop geometrical optimization strategies on the fan blades to reduce noise emission.
Therefore, as a second step, the sound sources are localized with a microphone array. The sound field in the rotating frame of reference is calculated with the acoustic ray method (ARM) [34] and the modal decomposition method in combination with Daniell’s method [35] is used to calculate microphone auto and cross spectra in the rotating frame of reference. Then, CLEAN-SC is applied to the beamformer output to improve the resolution and the dynamic range of the acoustic source maps [36]. Further processing parameters for the acoustic source maps correspond to those defined in Table 3. The following results refer to the design point of the fans at  1.1 m3 s−1 with the constant rotational speed of fR = 24.8 Hz.
Processing parameters for the acoustic source map.
Acoustic source maps are exemplarily evaluated for the one-third octave band having a center frequency fc = 4 kHz (Fig. 10). The dominant sound sources are localized near the leading edge for the reference fan, whereas they are shifted towards the trailing edge for the slitted fan blades. Hence, the main sound generation mechanism for the reference fan is turbulence interaction noise. The slits at the leading edge reduce turbulence interaction noise, but create an increased turbulent boundary layer that generates broadband noise by convecting eddies past the trailing edge [38, 39]. For the fan blade variants h22_5_w0_5_d4_5 (Fig. 10b) and h22_5_w2_d10 (Fig. 10d), the sound sources are localized at the root of the slit in the middle of the fan blade and for the other slitted fan blades the sound sources are even shifted past the trailing edge. The highest noise generation is related to rotor self-noise [40] for the slitted fan blades.
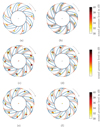 |
Figure 10 Acoustic source maps for the one-third octave band having a center frequency fc = 4 kHz evaluated with the ARM. The red marked area is the subregion of the leading edge and blue marked area is the subregion of the trailing edge. Volume flow rate |

For a more quantified analysis of the sound source distribution, integration regions around the leading edge and the trailing edge are defined (red and blue region in Fig. 10). It should be kept in mind that sound sources in the leading edge subregion do not only originate from leading edge noise. Instead, the integration range also includes sound sources on the blade surface, e.g., unsteady blade forces due to pressure fluctuations. The integrated source spectra were calculated for each blade subregion separately to determine the contribution of each blade subregion to the total sound pressure level. Further, the entire blade region is calculated as the sum of the two subregions. For brevity, the integrated spectra are exemplarily shown for the reference fan (Fig. 11a) and the fan h22_5_w1_d9 (Fig. 11b). The dominant sound sources for the reference fan are localized in the leading edge subregion for the frequency range f ∈ [2 kHz; 10 kHz], whereas they are localized in the trailing edge subregions for the fan h22_5_w1_d9. The integrated spectra for the trailing edge subregion are up to 6.9 dB higher compared to those for the leading edge subregions for the fan modified with slitted leading edges. Rotor self-noise makes a major contribution to the overall emitted sound of the slitted fans. Similar to the measured sound pressure spectra in Figure 5, the integrated spectra for the entire blade regions are higher for the slitted fan blades compared to the reference fan for frequencies above 2.5 kHz.
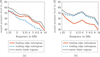 |
Figure 11 Integrated source spectra as calculated with the ARM. Volume flow rate |

In order to compare all slitted fans with the reference fan, the difference of the integrated one-third octave band spectra are compared separately for the leading edge subregions (Fig. 12a), the trailing edge subregions (Fig. 12b) and the entire blade regions (Fig. 12c). The comparison shows that slitted leading edges on the fan blades have a comparable effect on the noise emission independently of the geometry of the investigated slits. In contrast to Figure 7, the second hump at  is identified indicating noise reduction at the leading edges (Fig. 12a). This hump could not be identified from conventional far-field measurements (Fig. 7) as trailing edge noise is the dominant source of noise there. Due to the poor spatial resolution of the acoustic source maps at low frequencies, the first hump at
  could not be confirmed. Leading edge noise is reduced for the frequency range f ∈ [1.25 kHz; 10 kHz] for most of the variants. Since the dominant sound sources for the fans h22_5_w0_5_d4_5 and h22_5_w2_d10 are localized in the middle of the fan blade (e.g., Fig. 10), i.e., near the boundary between the subregions, some of the sound sources are assigned to the leading edge subregions and others near them to the trailing edge subregions. The sound sources in the trailing edge subregions are increased due to the slits for frequencies above 1.6 kHz. Looking at the difference of the integrated one-third octave band spectra for the entire blade regions, a sound reduction only at a dimensionless frequencies below
  is obtained. In conclusion, source localization clearly demonstrates that fan blades with slitted leading edges reduces the turbulence interaction noise and its noise reductions performance is limited by the increase in trailing edge noise.
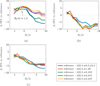 |
Figure 12 Difference of the integrated one-third octave band spectra from the slitted axial fans to the reference fan as a function of the dimensionless frequency. Volume flow rate |

4 Conclusions
The aerodynamic and aeroacoustic properties of five axial fan blades with slitted leading edges are evaluated and compared to axial fan blades with solid leading edges. Slitted leading edges result in a considerable reduction in turbulence interaction noise compared to a solid leading edge. Allowing cross-flow from the pressure to the suction side of the blade is beneficial for acoustics, but detrimental for aerodynamics. Nevertheless, a comparison of the axial fans at a constant pressure rise by adjusting the rotational speed of each fan shows that the slitted leading edges still produce less noise at volume flow rates above 0.6 m3 s−1. All considered slit variations reduce leading edge noise at low frequencies, but a penalty is observed at high frequencies. It was found that the maximum noise reduction due to the slits is at  . Thus, the maximum noise reduction is in a similar range as found for flat-plate airfoils with slits. Decreasing the ratio of slit spacing to slit width d/w increases the noise reduction performance. As the slit spacing decreases, the additional sound generated in the high frequency range increases because more slits are contained on the blade. Based on the dimensionless frequency
  , it could be determined that for values
  the slits with a width of w = 2 mm lead to a sound reduction and for values
  the slits generate more sound than the reference fan. With decreasing slit width w, this limit of
  shifts to higher values. Additional sound source localization methods revealed that the reduction of turbulence interaction noise on slitted flat-plate airfoils could be successfully transferred to axial fan blades and leading edge noise could be reduced due to the slits for a broad frequency range. Since trailing edge self-noise is significantly increased by the slits, additional modifications of the trailing edges are needed to achieve a better noise reduction at a comparable aerodynamic performance.
Conflict of interest
The authors declare no conflict of interest.
References
- F. Czwielong, S. Floss, M. Kaltenbacher, S. Becker: Influence of a micro-perforated duct absorber on sound emission and performance of axial fans. Applied Acoustics 174 (2021) 107746. [CrossRef] [Google Scholar]
- J. Tian, H. Ouyang, Y. Wu: Experimental and numerical study on aerodynamic noise of outdoor unit of room air conditioner with different grilles. International Journal of Refrigeration 32, 5 (2009) 1112–1122. [CrossRef] [Google Scholar]
- R. Arndt: Effect of leading edge serrations on noise radiation from a model rotor, in Society of Naval Architects and Marine Engineers, and US Navy, Advanced Marine Vehicles Meeting, July 17–19, 1972, Annapolis, Maryland, USA, 655. [Google Scholar]
- J.A. Feinerman, S. Koushik, F.H. Schmitz, Effect of leading-edge serrations on helicopter Blade-Vortex interaction noise, Journal of the American Helicopter Society 62, 3 (2017) 1–11. [CrossRef] [Google Scholar]
- T.M. Biedermann, P. Czeckay, T.F. Geyer, F. Kameier, C.O. Paschereit: Effect of inflow conditions on the noise reduction through leading edge serrations. AIAA Journal 57, 9 (2019) 4104–4109. [CrossRef] [Google Scholar]
- F. Krömer, F. Czwielong, S. Becker: Experimental investigation of the sound emission of skewed axial fans with leading-edge serrations. AIAA Journal 57, 12 (2019) 5182–5196. [CrossRef] [Google Scholar]
- T.M. Biedermann, P. Czeckay, N. Hintzen, F. Kameier, C.O. Paschereit: Applicability of aeroacoustic scaling laws of leading edge serrations for rotating applications. Acoustics 2, 3 (2020) 579–594. [CrossRef] [Google Scholar]
- A. Corsini, G. Delibra, A.G. Sheard: On the role of leading-edge bumps in the control of stall onset in axial fan blades. Journal of Fluids Engineering 135, 8 (2013) 081104. [CrossRef] [Google Scholar]
- R.C. Chanaud, N. Kong, R.B. Sitterding: Experiments on porous blades as a means of reducing fan noise. The Journal of the Acoustical Society of America 59, 3 (1976) 564–575. [CrossRef] [Google Scholar]
- S. Lee: Reduction of blade-vortex interaction noise through porous leading edge. AIAA Journal 32, 3 (1994) 480–488. [CrossRef] [Google Scholar]
- C. Ocker, T.F. Geyer, F. Czwielong, F. Krömer, W. Pannert, M. Merkel, S. Becker: Permeable leading edges for airfoil and fan noise reduction in disturbed inflow. AIAA Journal 59, 12 (2021) 4969–4986. [CrossRef] [Google Scholar]
- K. Bamberger, T. Carolus: Optimization of axial fans with highly swept blades with respect to losses and noise reduction. Noise Control Engineering Journal 60, 6 (2012) 716–725. [CrossRef] [Google Scholar]
- G. Herold, F. Zenger, E. Sarradj: Influence of blade skew on axial fan component noise. International Journal of Aeroacoustics 16, 4–5 (2017) 418–430. [CrossRef] [Google Scholar]
- F. Zenger, G. Herold, S. Becker: Acoustic characterization of forward-and backward-skewed axial fans under increased inflow turbulence. AIAA Journal 55, 4 (2017) 1241–1250. [CrossRef] [Google Scholar]
- F. Krömer: Sound emission of low-pressure axial fans under distorted inflow conditions, volume Reihe B: Medizin. FAU University Press, 2018. [Google Scholar]
- F. Krömer, S. Moreau, S. Becker: Experimental investigation of the interplay between the sound field and the flow field in skewed low-pressure axial fans. Journal of Sound and Vibration 442 (2019) 220–236. [CrossRef] [Google Scholar]
- A. Corsini, F. Rispoli: Using sweep to extend the stall-free operational range in axial fan rotors. Proceedings of the Institution of Mechanical Engineers, Part A: Journal of Power and Energy 218, 3 (2004) 129–139. [CrossRef] [Google Scholar]
- P. Chaitanya, P. Joseph: Slitted leading edge profiles for the reduction of turbulence-aerofoil interaction noise. The Journal of the Acoustical Society of America 143, 6 (2018) 3494–3504. [CrossRef] [PubMed] [Google Scholar]
- P. Chaitanya, P. Joseph, L. Ayton: On the superior performance of leading edge slits over serrations for the reduction of aerofoil interaction noise, in AIAA/CEAS Aeroacoustics Conference, June 25–29, 2018, Atlanta, Georgia, USA, 3121. [Google Scholar]
- M. Cannard, P. Joseph, J. Turner, J.W. Kim, P. Chaitanya: Physical mechanisms and performance of slitted leading-edge profiles for the reduction of broadband aerofoil interaction noise. Journal of Sound and Vibration 473 (2020) 115214. [CrossRef] [Google Scholar]
- P. Chaitanya, S. Narayanan, P. Joseph, J. Kim: Leading edge serration geometries for significantly enhanced leading edge noise reductions, in 22nd AIAA/CEAS Aeroacoustics Conference, 30 May–1 June, 2016, Lyon, France, 2736. [Google Scholar]
- F. Czwielong, F. Krömer, P. Chaitanya, S. Becker: Experimental investigation of the influence of different leading edge modifications on the sound emission of axial fans downstream of a heatexchanger, in Proceedings of the 23rd International Congress on Acoustics. 2019, 1843–1850. [Google Scholar]
- F. Zenger, A. Renz, M. Becher, S. Becker: Experimental investigation of the noise emission of axial fans under distorted inflow conditions. Journal of Sound and Vibration 383 (2016) 124–145. [CrossRef] [Google Scholar]
- V. Babu: Basics of turbomachinery. Fundamentals of Propulsion, Springer, 2022, pp. 25–42. [CrossRef] [Google Scholar]
- F. Czwielong, V. Hruška, M. Bednařík, S. Becker: On the acoustic effects of sonic crystals in heat exchanger arrangements. Applied Acoustics 182 (2021) 108253. [CrossRef] [Google Scholar]
- F. Czwielong, F. Krömer, S. Becker: Experimental investigations of the sound emission of axial fans under the influence of suction-side heat exchangers, in 25th AIAA/CEAS Aeroacoustics Conference, May 20–23, 2019, Delft, The Netherlands, 2618. [Google Scholar]
- S. Schoder, C. Junger, M. Kaltenbacher: Computational aeroacoustics of the EAA benchmark case of an axial fan. Acta Acustica 4, 5 (2020) 22. [CrossRef] [EDP Sciences] [Google Scholar]
- W. Pannert, C. Maier, Rotating beamforming – motion-compensation in the frequency domain and application of high-resolution beamforming algorithms: Journal of Sound and Vibration 333, 7 (2014) 1899–1912. [CrossRef] [Google Scholar]
- S.E. Wright: The acoustic spectrum of axial flow machines. Journal of Sound and Vibration 45, 2 (1976) 165–223. [CrossRef] [Google Scholar]
- A.S.H. Lau, S. Haeri, J.W. Kim: The effect of wavy leading edges on aerofoil–gust interaction noise. Journal of Sound and Vibration 332, 24 (2013) 6234–6253. [CrossRef] [Google Scholar]
- P. Chaitanya, P. Joseph, S. Narayanan, C. Vanderwel, J. Turner, J.W. Kim, B. Ganapathisubramani: Performance and mechanism of sinusoidal leading edge serrations for the reduction of turbulence–aerofoil interaction noise. Journal of Fluid Mechanics 818 (2017) 435–464. [CrossRef] [Google Scholar]
- M.J. Lighthill, M.H.A. Newman: On sound generated aerodynamically I. General theory. Proceedings of the Royal Society of London. Series A. Mathematical and Physical Sciences 211, 1107 (1952) 564–587. [Google Scholar]
- R. Ewert, W. Schröder: Acoustic perturbation equations based on flow decomposition via source filtering. Journal of Computational Physics 188, 2 (2003) 365–398. [Google Scholar]
- C. Ocker, W. Pannert: Acoustic ray method derived with the concept of analogue gravity for the calculation of the sound field due to rotating sound sources. Applied Acoustics 168 (2020) 107422. [CrossRef] [Google Scholar]
- C. Ocker, W. Pannert: Calculation of the cross spectral matrix with Daniell’s method and application to acoustical beamforming. Applied Acoustics 120 (2017) 59–69. [CrossRef] [Google Scholar]
- P. Sijtsma: CLEAN Based on Spatial Source Coherence. International Journal of Aeroacoustics 6, 4 (2007) 357–374. [CrossRef] [Google Scholar]
- E. Sarradj: Three-dimensional acoustic source mapping with different beamforming steering vector formulations. Advances in Acoustics and Vibration 1–12 (2012) 2012. [Google Scholar]
- S. Wagner, R. Bareiß, G. Guidati: Wind Turbine Noise. Springer, Berlin Heidelberg, 1996. [Google Scholar]
- W.K. Blake: Mechanics of flow-induced sound and vibration, Volume 2: Complex flow-structure interactions. Academic Press Inc. 2017. [Google Scholar]
- Q. Zhou, P. Joseph: Frequency-domain method for rotor self-noise prediction. AIAA Journal 44, 6 (2006) 1197–1206. [CrossRef] [Google Scholar]
Cite this article as: Ocker C. Czwielong F. Chaitanya P. Pannert W. & Becker S. 2022. Aerodynamic and aeroacoustic properties of axial fan blades with slitted leading edges. Acta Acustica, 6, 48.
All Tables
All Figures
|
Figure 1 (a) Reference fan and (b) fan h22_5_w2_d15 with slitted leading edges. |
| In the text | |
|
Figure 2 Schematic of a fan blade with the relative velocity wi changing over the span. The areas in which the dominant sound sources are located are marked in blue and red. The design parameters slit width w, slit spacing d and slit height h are shown. The sound sources between leading edge and slit root are separated from each other by the slit height h. |
| In the text | |
|
Figure 3 (a) Conventional far-field noise measurement setup for axial fans and (b) microphone array measurement setup. |
| In the text | |
|
Figure 4 Characteristic curves for the reference fan and the fans with slitted leading edges. (a) Aerodynamic curves, (b) overall sound pressure levels. |
| In the text | |
|
Figure 5 Sound pressure spectra for a volume flow rate |
| In the text | |
|
Figure 6 Wall-pressure fluctuations on the suction side of the fan. |
| In the text | |
|
Figure 7 Difference one-third octave band spectra from the slitted axial fans to the reference fan as a function of the dimensionless frequency. |
| In the text | |
|
Figure 8 (a) Rotational speed and (b) overall sound pressure level as a function of the volume flow rate for the reference fan and the fans with slitted leading edges at a constant pressure rise. |
| In the text | |
|
Figure 9 Sound pressure spectra for a volume flow rate |
| In the text | |
|
Figure 10 Acoustic source maps for the one-third octave band having a center frequency fc = 4 kHz evaluated with the ARM. The red marked area is the subregion of the leading edge and blue marked area is the subregion of the trailing edge. Volume flow rate |
| In the text | |
|
Figure 11 Integrated source spectra as calculated with the ARM. Volume flow rate |
| In the text | |
|
Figure 12 Difference of the integrated one-third octave band spectra from the slitted axial fans to the reference fan as a function of the dimensionless frequency. Volume flow rate |
| In the text | |
Current usage metrics show cumulative count of Article Views (full-text article views including HTML views, PDF and ePub downloads, according to the available data) and Abstracts Views on Vision4Press platform.
Data correspond to usage on the plateform after 2015. The current usage metrics is available 48-96 hours after online publication and is updated daily on week days.
Initial download of the metrics may take a while.