| Issue |
Acta Acust.
Volume 6, 2022
|
|
|---|---|---|
| Article Number | 49 | |
| Number of page(s) | 5 | |
| Section | Building Acoustics | |
| DOI | https://doi.org/10.1051/aacus/2022045 | |
| Published online | 25 October 2022 | |
Short Communication
Towards an alternative representation of indoor acoustic environment
CSTB Centre Scientifique et Technique du Bâtiment, 24 Rue Joseph Fourier, 38400 Saint Martin d'Hères, France
* Corresponding author: This email address is being protected from spambots. You need JavaScript enabled to view it.
Received:
8
July
2022
Accepted:
6
October
2022
Abstract
The purpose of this investigation is to propose an alternative indoor sound spectrum based on objective and verifiable data, representative for an average household in Europe. It is obtained from the energetic sum of the emission spectra of sound sources commonly found in residential buildings, each weighted by its estimated occurrence time. Such a spectrum could then be used to evaluate airborne sound transmission performance.
Key words: Building acoustics / Indoor noise / Acoustic rating / Sound transmission
© The Author(s), Published by EDP Sciences, 2022
 This is an Open Access article distributed under the terms of the Creative Commons Attribution License (https://creativecommons.org/licenses/by/4.0), which permits unrestricted use, distribution, and reproduction in any medium, provided the original work is properly cited.
1 Introduction
Currently, the protection against airborne sound transmission between two rooms is evaluated through a single number quantity (SNQ) composed of the weighted sound level difference or the sound transmission index, to which is added a spectrum adaptation term C, see ISO 717-1 [1]. The calculation procedure is based on the use of A-weighted pink noise as a reference sound source. The choice of pink noise to represent the current acoustic environment in buildings is not clearly justified in the standard, but is the result of its 1996 revision merging the German rating-curve method with the French source-spectrum method (pink noise from 100 to 5000 Hz). It also raises growing questions, regarding the noise of modern service equipment, household appliances and audio-visual devices, in particular. As a matter of fact, subjective ratings of noise disturbance were analysed in relation to the household activities and physical properties of flats [2]. They were found to be affected by different sorts of domestic appliance, such as kitchen equipment, television, radio and hi-fi unit, leading to the idea of using the number of events and realistic noise spectra for building acoustic performance evaluation.
This paper aims at proposing a new indoor sound spectrum based on objective and verifiable data, representative for an average household in Europe. It is obtained from the energetic sum of the emission spectra of sound sources commonly found in residential buildings, each weighted by its estimated occurrence time. This work was part of a broader study aiming at proposing new sound insulation descriptors. The newly proposed indoor sound spectrum was used to define alternative SNQ. Their perceptual relevance was then assessed by means of loudness calculations. The main results of this study can be found in a companion paper [3].
2 Indoor sources: proposed classification of indoor noise sources
This section proposes a list of the most relevant indoor noise types and an estimate of their representativity.
2.1 Subjective list of indoor noise sources
A non-exhaustive list of possible sources of indoor noise was created subjectively, yielding a first list of 83 sources of noise ordered according to the following types:
house appliances (refrigerator, vacuum cleaner, etc.)
building service equipment (plumbing noise, AC and ventilation units, etc.)
do-it-yourself (DIY) equipment (drill, electric saw, etc.)
musical instruments (piano, etc.)
behaviour (human voices, pets, doors, footsteps, etc.)
Some types of sound sources are excluded from the scope of this study: sources of pure structure-borne sound (e.g., footsteps, slamming doors, moving furniture) and sources that are not considered as part of the normal use of dwellings (e.g., smoke detector alarm, DIY tools). Indeed, these sources raise new questions when trying to determine their representativity or their spectral characteristics.
2.2 Selection of representative indoor noise sources
In order to select a representative set of indoor noise sources, the following approach is proposed.
The method is based on statistical data provided by Eurostat [4]. Note that no work was found in the acoustic literature on the use of such data to deduce statistical information on the percentage of occurrence of indoor noise types. It appears however as a valuable source to estimate the average occurrence of indoor noise in dwellings. This data gives the amount of daily time spent on average for a set of activities in 21 European countries. By weighting the amount of time by the population in each country, a daily time spent estimate is obtained for each activity, averaged across Europe.
The next step is to use this data to estimate the time spent for each source of the subjective list. The difficulty is that the Eurostat categories are generally too broad to differentiate between individual source types. Television data is an exception. For this source type, the Eurostat time spent gives a statistically valid number of daily hours. For most of the other sources, assumptions must be made as to their relative running time. To take advantage of the statistical data provided by Eurostat, similar categories of sources are considered in order to reduce the number of relevant sources from the subjective list. A total of 16 source categories are selected at the end of this process. They are listed in Table 1.
Relative importance and associated parameters for the selected indoor sound source categories.
To estimate the importance of a source, an importance indicator is defined for each sound source category, based on its occurrence, as described below. Categories with a high importance value indicator are more likely to contribute to the indoor noise.
When the occurrence time for the ith category can be considered as independent from the number of occupants in the dwelling or room (e.g., refrigerator, ventilation), an average weekly occurrence indicator Tavg,weekly,i is calculated as: (1)where Rparticipation,EU,i is the participation rate, i.e., the estimated share (in %) of European dwellings where the considered source category is present or the share of the population who reports engaging in the considered activity on a regular basis, and Tdaily,i is the average daily occurrence time (in hours).
One difficulty with this method is to correctly take into account sound sources for which the occurrence time depends on the number of occupants (e.g., daily grooming). For such sources, the average daily occurrence time corresponds to the usage time by one occupant. Therefore, the weekly occurrence indicator is calculated as: (2)where NAvgHousehold,EU is the average household size in Europe, estimated to 2.3 members [5].
Once the weekly occurrence indicator is determined for all considered sound sources, the values are normalized as follows to obtain the relative importance indicator Ki: (3)The relative importance indicator is estimated for the 16 source categories listed in Table 1 by order of decreasing importance. The origin of the parameter values considered in the calculation is specified in order to provide an indication of their reliability (pure assumptions being referred to as “assum.”).
The above approach raises the following remarks:
The relative importance is related to an estimated occurrence rather than to a reported annoyance.
Only a few source types have reliable usage data associated with them. Other sources need further verification and cross validation. Another set of sources do not have statistical data available and for these sources, the importance indicator relies on assumptions that have not been measured or validated. For the same reason, some specific sound sources were completely neglected in this analysis, even if they can be responsible for important sound levels (e.g., musical instruments).
The multiplication factor related to the average household size doubles the estimated representativity for a given source and therefore is an influent parameter. Its use can be subject to discussion for specific sound sources as they are dependent on the habits of the household. For example, one member can do the dishes for all the household, or each member can do it for himself, or even several occupants can even do it together (but for a shorter time). Similarly, several members can watch the TV together, or separately at different times. These examples show that, even when statistical data are available regarding the participation rate or daily occurrence time, assumptions remain necessary and subject to discussion. The scenario of several members being simultaneously engaged in the same activity in different rooms of the dwelling is not considered relevant in this work.
3 Spectral characteristics of indoor sources
Each source category listed in Table 1 is qualified in terms of emission levels. A typical indoor noise spectrum can then be obtained as the sum of the emission levels weighted by the values of the relative importance indicator.
Very few published results containing sound power spectra of indoor sources were found: 5 refrigerator models in [6] and human voices in [7] (used to represent meals). To gather more spectral characteristics, calibrated audio recordings were made in two different dwellings, using a SQobold portable measuring system from HEAD Acoustics and a Brüel & Kjær Type 4966 microphone. Due to the significant level variations of some sources, the percentile index L10, i.e., the level exceeded 10% of the time, was considered (for stationary sounds, the percentile indices are equal to the equivalent level index, Leq). Spectra were measured in one third octave bands between 50 and 5000 Hz. The sound power level was then obtained in each one third octave band, considering both direct and reverberant sound fields, as: (4)where d is the distance from the considered source to the microphone (comprised between 1 and 3 m), Q is the source directivity factor and A is the total sound absorption area of the room (in m2), estimated from the room dimensions and typical sound reverberation time values. The directivity factor is determined based on assumptions for each sound source and considered always equal or higher than 2. However, this parameter has little influence as the reverberant sound field is dominant. Finally, L10 values that are lower than the background noise level + 6 dB were excluded from the analysis.
Note that this approach was chosen because it is simple and allows for an important number of in-situ characterizations. However, this can come at the expense of accuracy and the resulting sound power spectra may differ from data measured in acoustic laboratories. Overall, 9 spectra were taken from the literature and 62 spectra were obtained from calibrated recordings.
For each source category, the measured spectra are combined following two separate methods:
Calculation of an energetic average of the different spectra (hereafter referred to as “AVG” spectrum).
Selection of the maximum value at each one third octave band (hereafter referred to as “MAX” spectrum).
The AVG and MAX spectra are then smoothed by applying a running average on 3 consecutive one third octave bands to attenuate strong spectral variations due to one individual source.
This approach was initially proposed for sources with a wide range of operating conditions (e.g., different music types or volume/equalization settings of an audio device). It should be noted that this approach does not consider the occurrence time of each individual sound source in the category. Therefore, the AVG and MAX spectra are strongly dependent on the available data and may not be statistically valid.
4 Proposed alternative indoor sound spectrum
The equivalent indoor sound spectrum is obtained from the characteristics (relative occurrence and emission spectrum) of the sound source categories presented in Table 1 as: (5)where N = 16 is the number of sound source categories, Ki is the relative importance factor of the ith category and LW,i,j is the estimated sound power level of the ith category for frequency band j.
The above estimate is applied to both the averaged spectra (AVG) and the maximum spectra (MAX). The results are shown in Figure 1, where the indoor sound spectrum labelled as “TOTAL” is the energetic weighted sum of all 16 spectra.
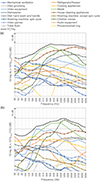 |
Figure 1 Alternative indoor sound spectrum derived from (a) the AVG spectra and (b) the MAX spectra, of the considered sound source categories. |
As shown in Figure 1(a), the indoor sound spectrum derived from the AVG spectra has less low-frequency content than the pink noise spectrum currently considered in ISO 717-1 [1] and is rather flat above 500 Hz.
However, the AVG spectra proposed for each category are strongly dependent on the quantity and quality of the available data. Given the small number of recordings and the simplifications made to derive the sound power level of each recording, it should be considered that these AVG spectra are subject to significant uncertainties.
The indoor sound spectrum derived from the MAX spectra, see Figure 1(b), is also different from pink noise, with less low-frequency content but also less energy in the high frequency range. The MAX spectra of each category are associated to similar uncertainty levels as the AVG spectra.
Thus, these results should be considered as a first step and therefore taken with care.
5 Idealized indoor noise spectrum
In order to facilitate the calculation of SNQ ratings, the spectra presented above for the AVG and MAX cases are idealized as shown in Figure 2. Both idealized spectra (dashed line) have a positive slope of 1.5 dB per 1/3-octave between 50 and 500 Hz, then a constant value. One of the idealized spectra has a negative slope of 1.0 dB per 1/3-octave between 2 and 5 kHz to better fit the shape of the corresponding “raw” spectrum (solid line). It should be noted that a pink noise spectrum in one-third octave band would correspond to a constant value.
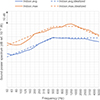 |
Figure 2 Proposed alternative indoor sound spectra. |
6 Conclusion
This paper presented a newly proposed indoor sound spectrum as well as the background data and the different calculation steps leading to it. It should be stressed that this definition of an indoor sound spectrum only relies on occurrence, and does not consider reported, subjective annoyance or disturbance of the involved sounds or sound sources.
Only a small amount of useful data was found in the literature. Many assumptions were necessary to determine the relative importance of the considered sound sources based on occurrence. Some sound sources even had to be neglected, although it can be expected that they have a strong influence on the indoor acoustic environment (e.g., musical instruments, social gatherings, etc…).
For the same reason, most of the spectral characteristics were obtained by means of calibrated audio recordings performed in situ (more than 60 in total) and analysed with a simplified method. This method still needs to be validated, for example by comparing the sound power spectrum estimated for a reference to laboratory characterization results for the same source.
The obtained idealized indoor noise spectra have less energy at low frequencies than the pink noise used in the current standard, and more research is definitely needed in order to confirm such result and propose changes in current practice.
The confidence level associated with the proposed indoor sound spectra might also be improved by means of long-term acoustic monitoring in a statistically representative number of dwellings or other building types, although this solution might be particularly costly. Moreover, acceptance by building occupants might be a practical difficulty, in a context of growing concerns about privacy. Large scale participatory studies could take advantage of mobile devices to have sound levels measured by the occupants themselves, provided that special precautions are taken to ensure the accuracy and reliability of the data.
Conflict of interest
The authors declare no conflict of interest.
Acknowledgments
The authors acknowledge the financial support of the project “Proposal and impact assessment of an alternative sound insulation rating” by Eurogypsum and Eurima. This project was carried out through a collaboration between CSTB and KU Leuven. The authors also wish to thank Stéphanie COLIN who helped with the research on statistical data and literature review during her stay at CSTB.
References
- EN ISO 717-1:2013: Acoustics – Rating of sound insulation in buildings and of building elements – Part 1: Airborne sound insulation (2013). [Google Scholar]
- G.J. Raw, N.A. Oseland: Subjective response to noise through party floors in conversion flats. Applied Acoustics 32, 3 (1991) 215–231. [CrossRef] [Google Scholar]
- M. Rychtáriková, S. Bailhache, L. Zelem, V. Chmelík, C. Glorieux: Zwicker’s Loudness model as a robust calculation method for assessment of adequacy of airborne sound insulation descriptors. Acta Acustica (submitted). [Google Scholar]
- Eurostat: Time spent, participation time and participation rate in the main activity by sex and month of the year (2010). https://ec.europa.eu/eurostat/web/products-datasets//tus_00month [Google Scholar]
- Eurostat: Statistics explained – Household composition statistics (2020). https://ec.europa.eu/eurostat/statistics-explained/index.php/Household_composition_statistics [Google Scholar]
- J. Jeon, J. You, H. Chang: Sound radiation and sound quality characteristics of refrigerator noise in real living environments. Applied Acoustics 68, 10 (2007) 1118–1134. [CrossRef] [Google Scholar]
- Odeon: Odeon application notes – Restaurants (July 2012). https://odeon.dk/pdf/Application_Note_Restaurants.pdf [Google Scholar]
- J.-P. Lucas, O. Ramalho, S. Kirchner, J. Ribéron: Etat de la ventilation dans le parc de logements français (2009). [Google Scholar]
- Groupement Interprofessionnel des Fabricants d’Appareils d’Equipement Ménager: Bilan Eco 2011 (2011). [Google Scholar]
- INSEE: Tableaux de l'économie française – Edition 2017 – Equipement des ménages (2 March 2017). https://www.insee.fr/fr/statistiques/2569366?sommaire=2587886 [Google Scholar]
Cite this article as: Bailhache S. Maillard J. & Guigou-Carter C. 2022. Towards an alternative representation of indoor acoustic environment. Acta Acustica, 6, 49.
All Tables
Relative importance and associated parameters for the selected indoor sound source categories.
All Figures
|
Figure 1 Alternative indoor sound spectrum derived from (a) the AVG spectra and (b) the MAX spectra, of the considered sound source categories. |
| In the text | |
|
Figure 2 Proposed alternative indoor sound spectra. |
| In the text | |
Current usage metrics show cumulative count of Article Views (full-text article views including HTML views, PDF and ePub downloads, according to the available data) and Abstracts Views on Vision4Press platform.
Data correspond to usage on the plateform after 2015. The current usage metrics is available 48-96 hours after online publication and is updated daily on week days.
Initial download of the metrics may take a while.