Figure 1
Download original image
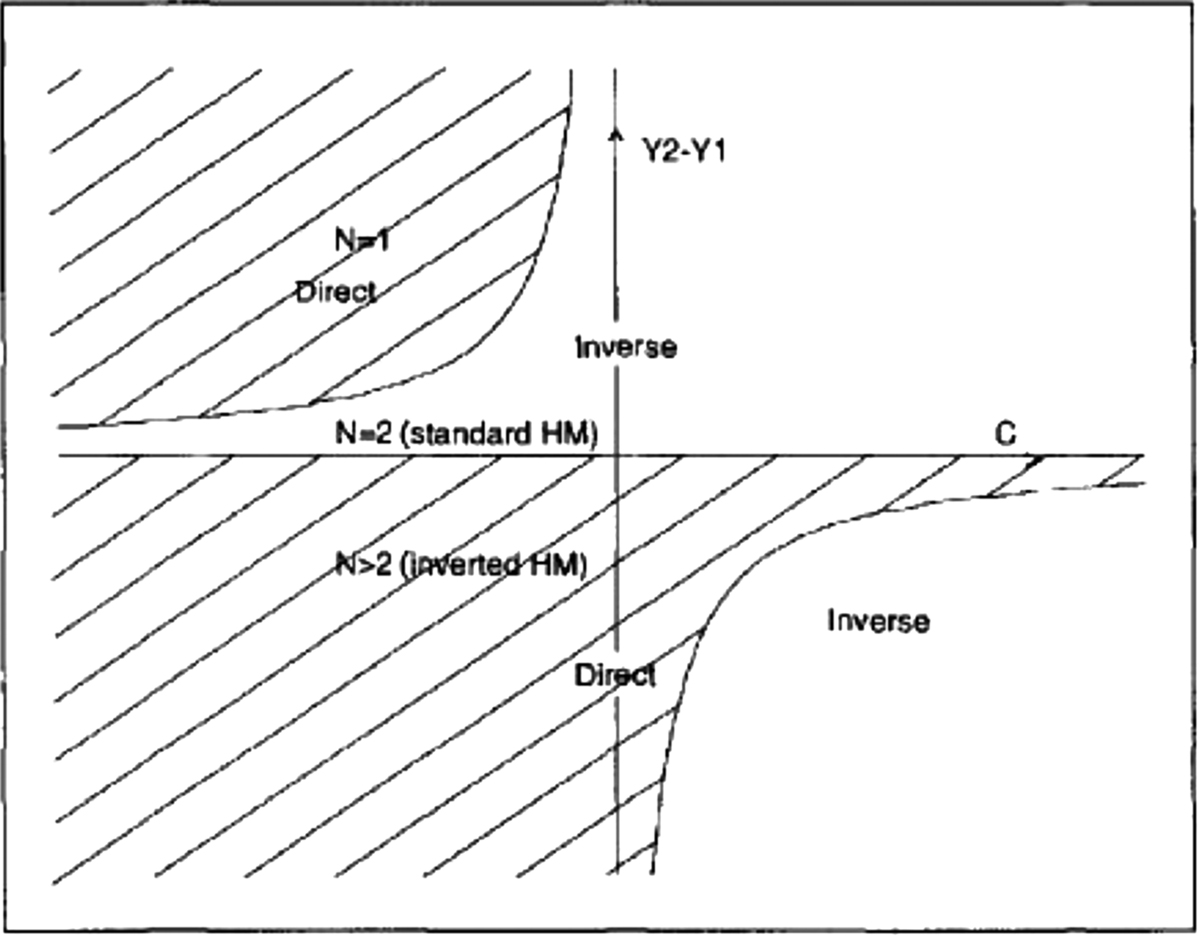
Diagram showing the regions where the bifurcation is direct as well as those regions where it is inverse. The x-axis shows the values of the third coefficient of the Taylor expansion Equation (6), and the y-axis is the difference between the admittance amplitude between the two first resonances (assumed to be harmonic) Y2 −Y1 = 1/Z2 − 1/Z1. The hatched region is for a direct bifurcation, and the unhatched region for an inverse bifurcation. Adapted from [26].
Current usage metrics show cumulative count of Article Views (full-text article views including HTML views, PDF and ePub downloads, according to the available data) and Abstracts Views on Vision4Press platform.
Data correspond to usage on the plateform after 2015. The current usage metrics is available 48-96 hours after online publication and is updated daily on week days.
Initial download of the metrics may take a while.