Figure 2
Download original image
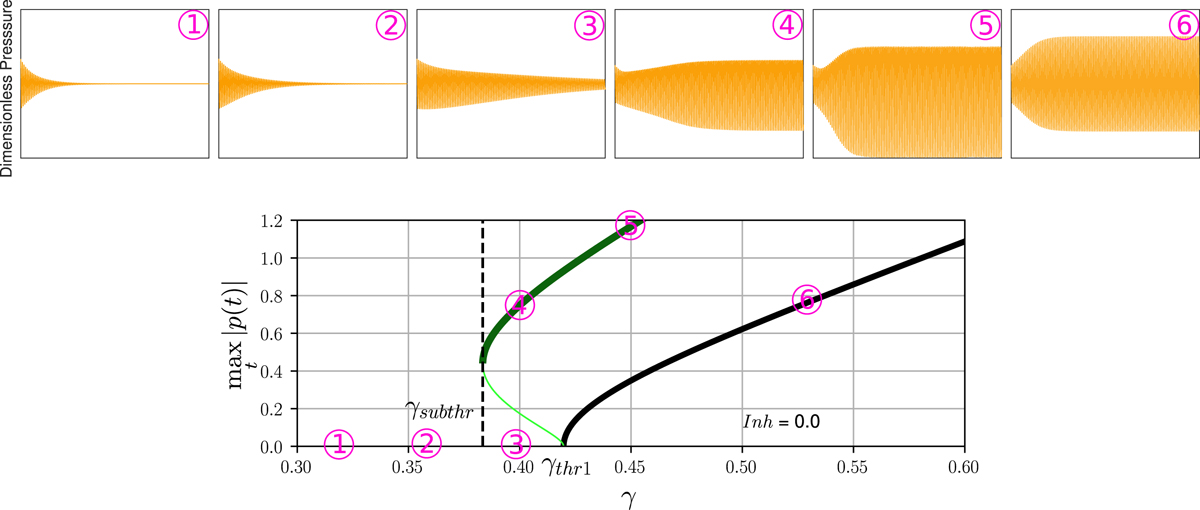
Bifurcation diagram and time domain simulations of the two harmonic resonance air column (parameter’s values in Tab. 1 with Z2 = Z1/1.5 or with Z2 = 0, and Inh = 0) with respect to the control parameter γ. Upper plots: six time domain simulations of the dimensionless pressure p = p1 + p2 calculated between t = 0 and t = 0.5 s for γ = 0.32, γ = 0.36, γ = 0.40 (two simulations with different initial conditions), γ = 0.45 and γ = 0.53. The dimensionless pressure of the plots numbered from 1 to 3 (respectively 4 to 6) is displayed between −0.3 and +0.3 (respectively −1.2 and +1.2). Lower plot: Maximum of the absolute value of the periodic solution p over one period with respect to γ. The branch in green (respectively in black) corresponds to the case Z2 = Z1/1.5 (respectively Z2 = 0), and illustrates an inverse (respectively direct) Hopf bifurcation scenario. Stable (respectively unstable) solutions are plotted with thick (respectively thin) lines. For each scenario, the Hopf bifurcation point where the equilibrium becomes unstable, is noted γthr. In the case of an inverse bifurcation the subcrital threshold γsubthr is highlighted with a vertical dashed line.
Current usage metrics show cumulative count of Article Views (full-text article views including HTML views, PDF and ePub downloads, according to the available data) and Abstracts Views on Vision4Press platform.
Data correspond to usage on the plateform after 2015. The current usage metrics is available 48-96 hours after online publication and is updated daily on week days.
Initial download of the metrics may take a while.