Figure 3
Download original image
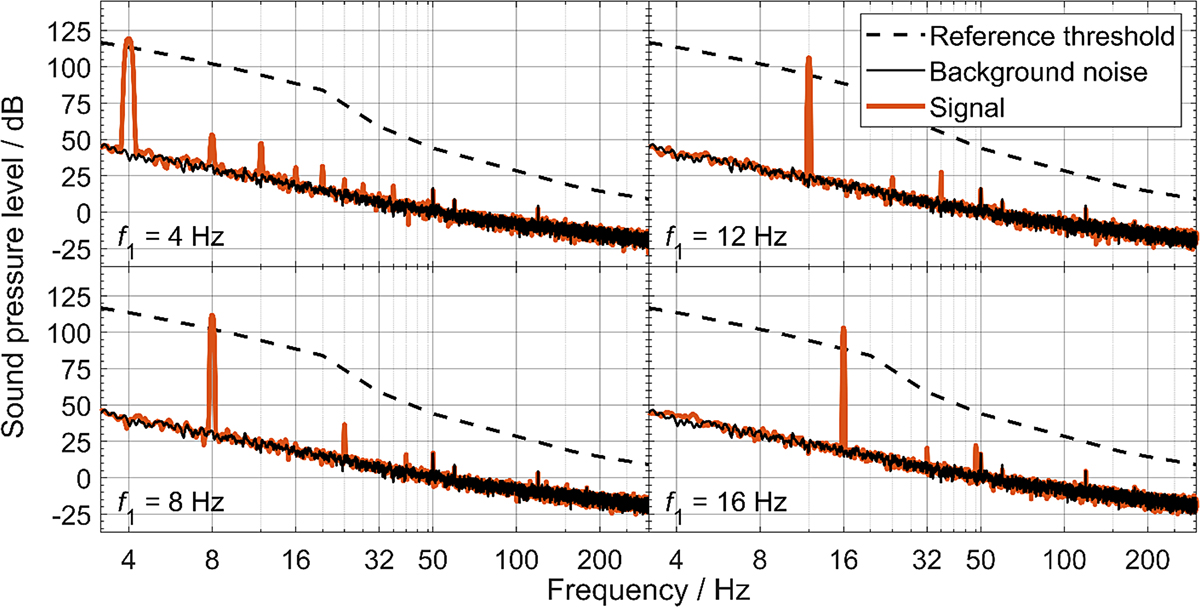
Magnitude spectra (orange solid lines) produced by the LDREPS in the occluded-ear simulator and measured with the ER-10B+ microphone. Each panel shows the averaged spectrum for a pure-tone signal at a level above its reference threshold. The signal frequency, f1, is indicated in the bottom left corner of the panel. For comparison, the spectrum of a background noise measurement is also shown (dark gray solid line). In addition, the reference thresholds are shown as a black dashed line. The frequency spectra are limited to the frequency range from 3 Hz to 300 Hz.
Current usage metrics show cumulative count of Article Views (full-text article views including HTML views, PDF and ePub downloads, according to the available data) and Abstracts Views on Vision4Press platform.
Data correspond to usage on the plateform after 2015. The current usage metrics is available 48-96 hours after online publication and is updated daily on week days.
Initial download of the metrics may take a while.