Figure 13
Download original image
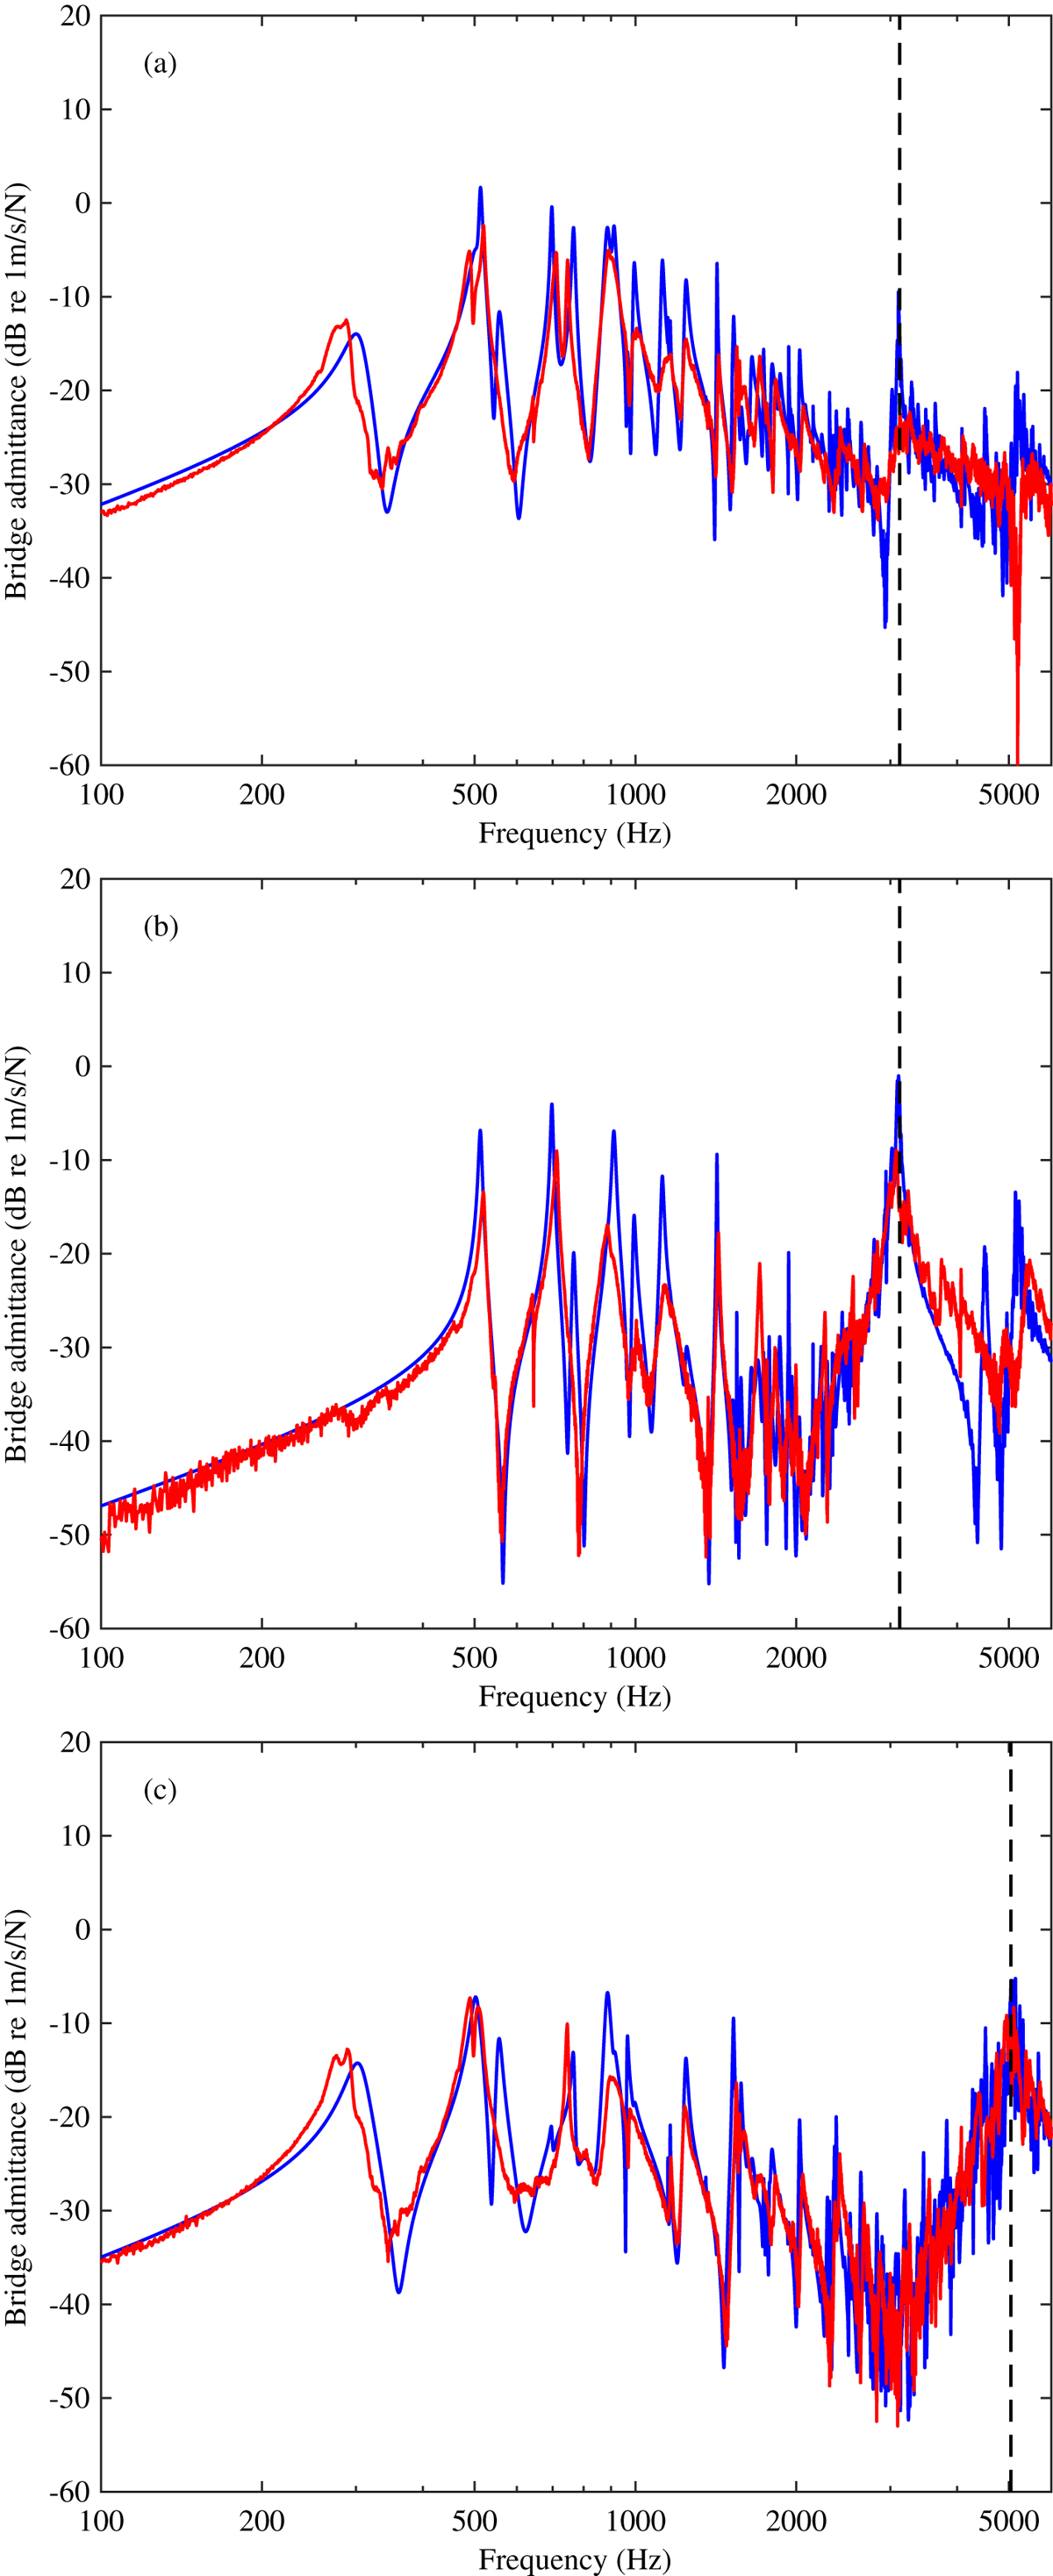
Bridge admittances (a) vertical at the bridge corner as measured on the Deering banjo (without resonator) (red) and as computed by the FE/BE model (blue); (b) horizontal at the bridge corner as measured (red) and as computed by the FE/BE model (blue); (c) vertical at the third string notch as measured (red) and as computed by the FE/BE model (blue). The vertical dashed lines in (a) and (b) indicate the frequency of the displacement plot in Figure 14a. The vertical dashed line in (c) indicates the frequency of the displacement plot in Figure 14b.
Current usage metrics show cumulative count of Article Views (full-text article views including HTML views, PDF and ePub downloads, according to the available data) and Abstracts Views on Vision4Press platform.
Data correspond to usage on the plateform after 2015. The current usage metrics is available 48-96 hours after online publication and is updated daily on week days.
Initial download of the metrics may take a while.