Figure 2
Download original image
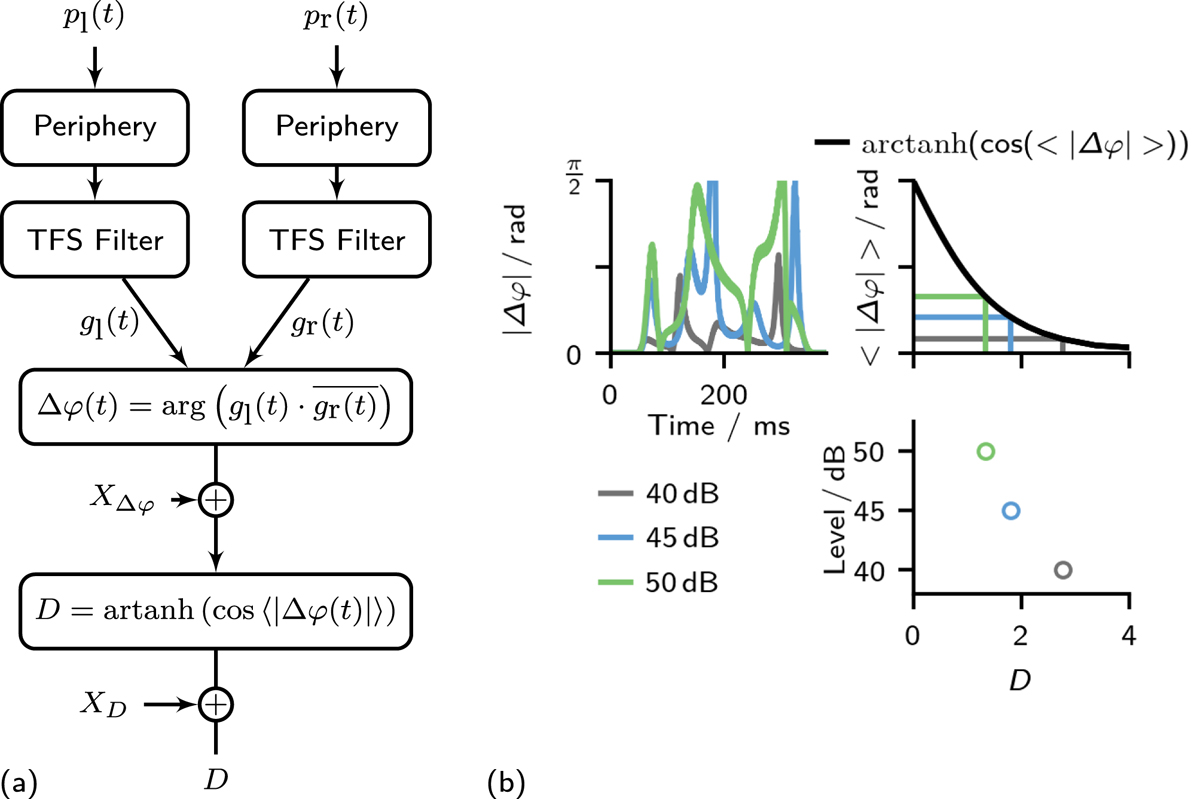
(a) Schematic of the proposed model. (b) Example of the decision stage for N0Sπ stimuli at different signal levels. The top left shows the absolute value of the instantaneous IPD over time. Increasing the target level (with an IPD of π) increases fluctuations and thus the mean absolute IPD (y-axis top right). Taking the cosine of the mean IPD results in smaller output values with increasing IPD fluctuations. The decision variable D results directly from the cosine, subject to a Fisher’s-Z transform, so that lower values indicate a stronger signal prevalence (bottom right).
Current usage metrics show cumulative count of Article Views (full-text article views including HTML views, PDF and ePub downloads, according to the available data) and Abstracts Views on Vision4Press platform.
Data correspond to usage on the plateform after 2015. The current usage metrics is available 48-96 hours after online publication and is updated daily on week days.
Initial download of the metrics may take a while.