Figure 1
Download original image
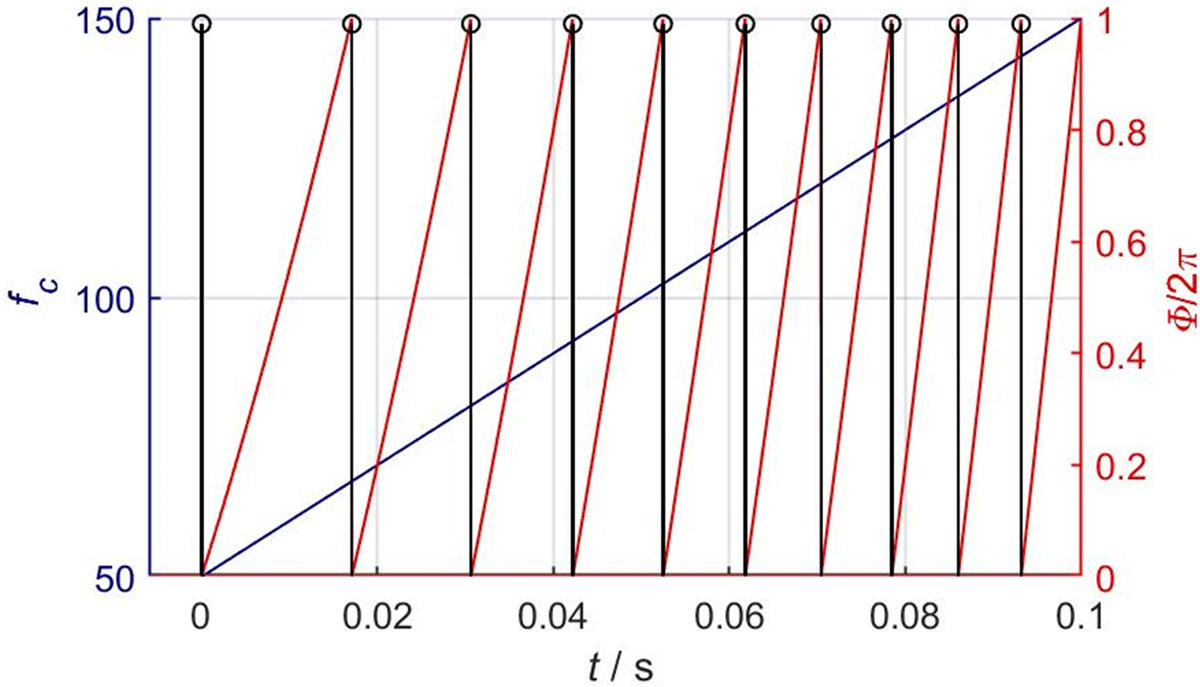
Principle of strobe-point generation: The fundamental frequency estimate of a periodic signal is assumed to increase linearly from 50 Hz to 150 Hz in the time interval 0–100 ms (blue curve, left scale). The corresponding phase function according to (2) is normalized by 2π and taken modulo 1 (red curve, right scale). Whenever the phase wraps, a strobe point is set (indicated by black bars with circles on top). The time span between subsequent strobe points indicates the stabilized period.
Current usage metrics show cumulative count of Article Views (full-text article views including HTML views, PDF and ePub downloads, according to the available data) and Abstracts Views on Vision4Press platform.
Data correspond to usage on the plateform after 2015. The current usage metrics is available 48-96 hours after online publication and is updated daily on week days.
Initial download of the metrics may take a while.