Figure 3
Download original image
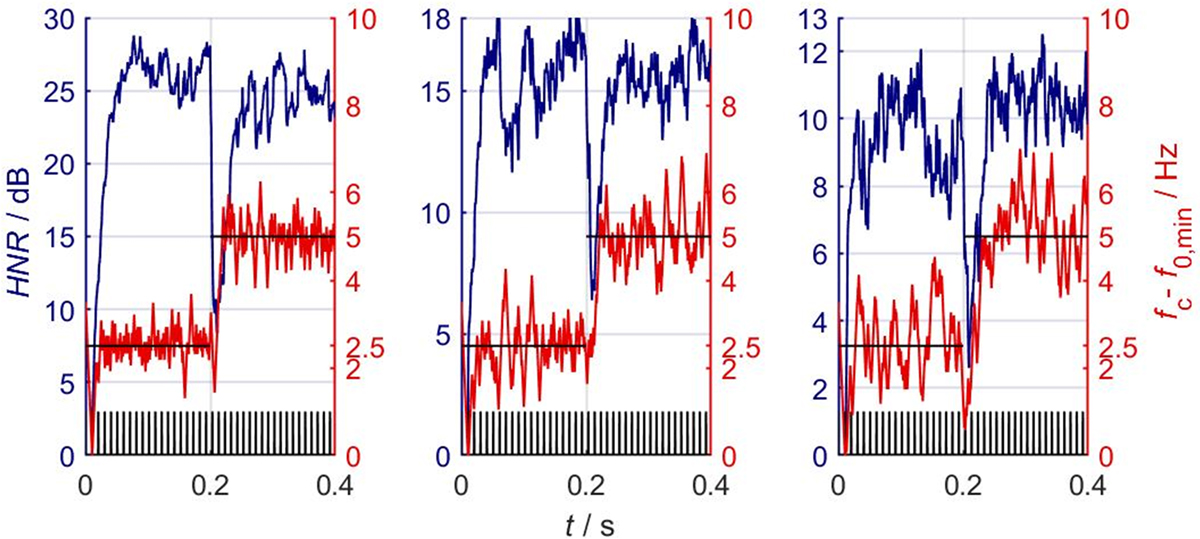
Simulation I: Complex tone with a fixed fundamental frequency of 98.5 Hz (1st half) and 101.0 Hz (2nd half), SNR is 21.5 dB, 7.5 dB and 1.5 dB (left, center and right panel). Each panel shows the PM-HLL oscillator frequency (i.e., fundamental frequency estimate) fc referenced to 96 Hz (red curve, right scale), the HNR (blue curve, left scale) and the strobe points (black bars), as a function of time. The black line shows the signal’s fundamental frequency trajectory. Data show quick convergence and small estimation variance even at the lowest SNR. The HNR depends on SNR and quickly goes low during loop adaptation, thus indicating the unlocked state.
Current usage metrics show cumulative count of Article Views (full-text article views including HTML views, PDF and ePub downloads, according to the available data) and Abstracts Views on Vision4Press platform.
Data correspond to usage on the plateform after 2015. The current usage metrics is available 48-96 hours after online publication and is updated daily on week days.
Initial download of the metrics may take a while.