Figure 8
Download original image
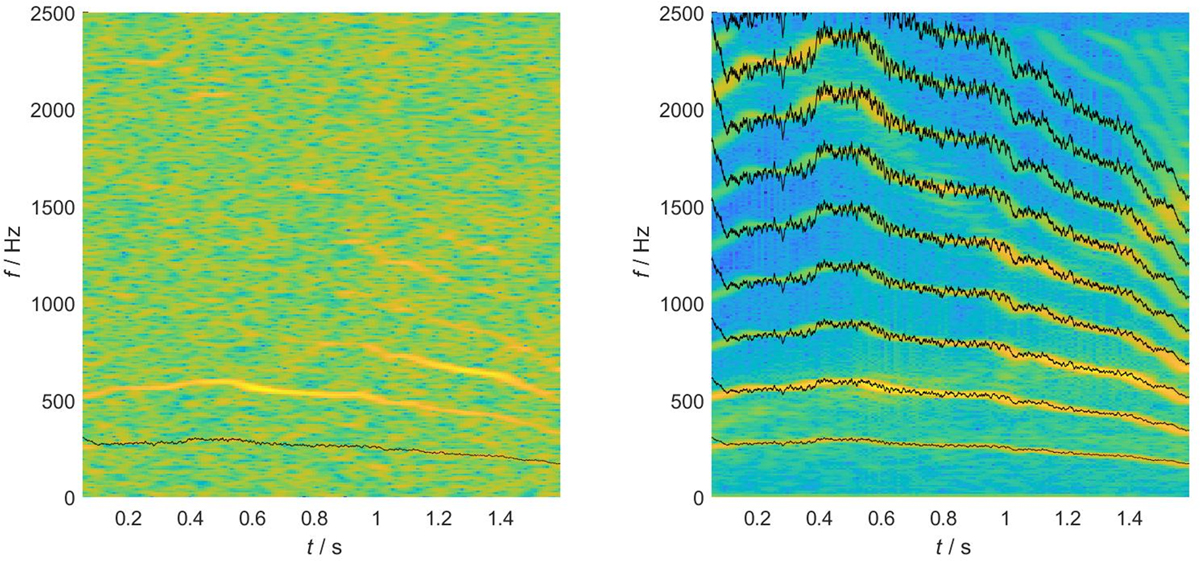
Spectrogram of a vocoded voiced speech signal with time-varying trajectories of fundamental frequency, first and second formant. The left panel shows the spectrogram of the signal at an SNR of 0 dB as well as the fundamental frequency estimate derived from the noisy signal with a PM-HLL instance that was started at an oscillator frequency fc of 310 Hz (black curve). The right panel shows the spectrogram of the clean voice and again the PM-HLL estimate, together with its integer multiples 2–9. The PM-HLL instance catches the fundamental frequency trajectory at about 100 ms into the signal and keeps track throughout the duration of the signal. Note that the spectrogram of the noisy signal does not show the fundamental, and most of the time only the second harmonic is visible.
Current usage metrics show cumulative count of Article Views (full-text article views including HTML views, PDF and ePub downloads, according to the available data) and Abstracts Views on Vision4Press platform.
Data correspond to usage on the plateform after 2015. The current usage metrics is available 48-96 hours after online publication and is updated daily on week days.
Initial download of the metrics may take a while.