Figure 6
Download original image
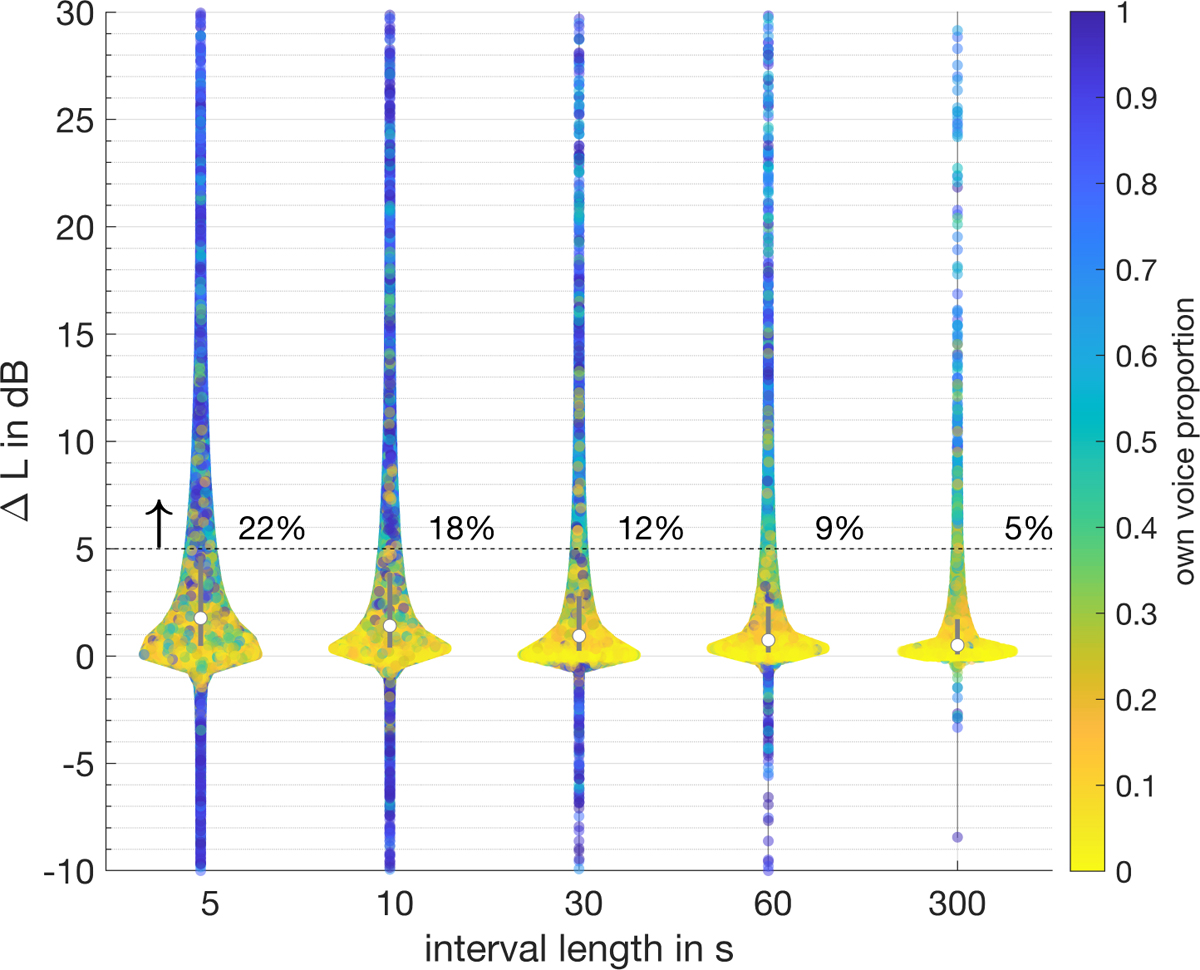
Influence of OVS exclusion on the mean A-weighted SPL in half-overlapping analysis intervals with different interval lengths for all participants and recording days. The color indicates the proportion of OVS in each interval. The median level difference is represented by the white dot and the interquartile range by the grey area. The percentages on the dashed line indicate the proportion of SPL differences greater than 5 dB.
Current usage metrics show cumulative count of Article Views (full-text article views including HTML views, PDF and ePub downloads, according to the available data) and Abstracts Views on Vision4Press platform.
Data correspond to usage on the plateform after 2015. The current usage metrics is available 48-96 hours after online publication and is updated daily on week days.
Initial download of the metrics may take a while.