Open Access
Figure 13
Download original image
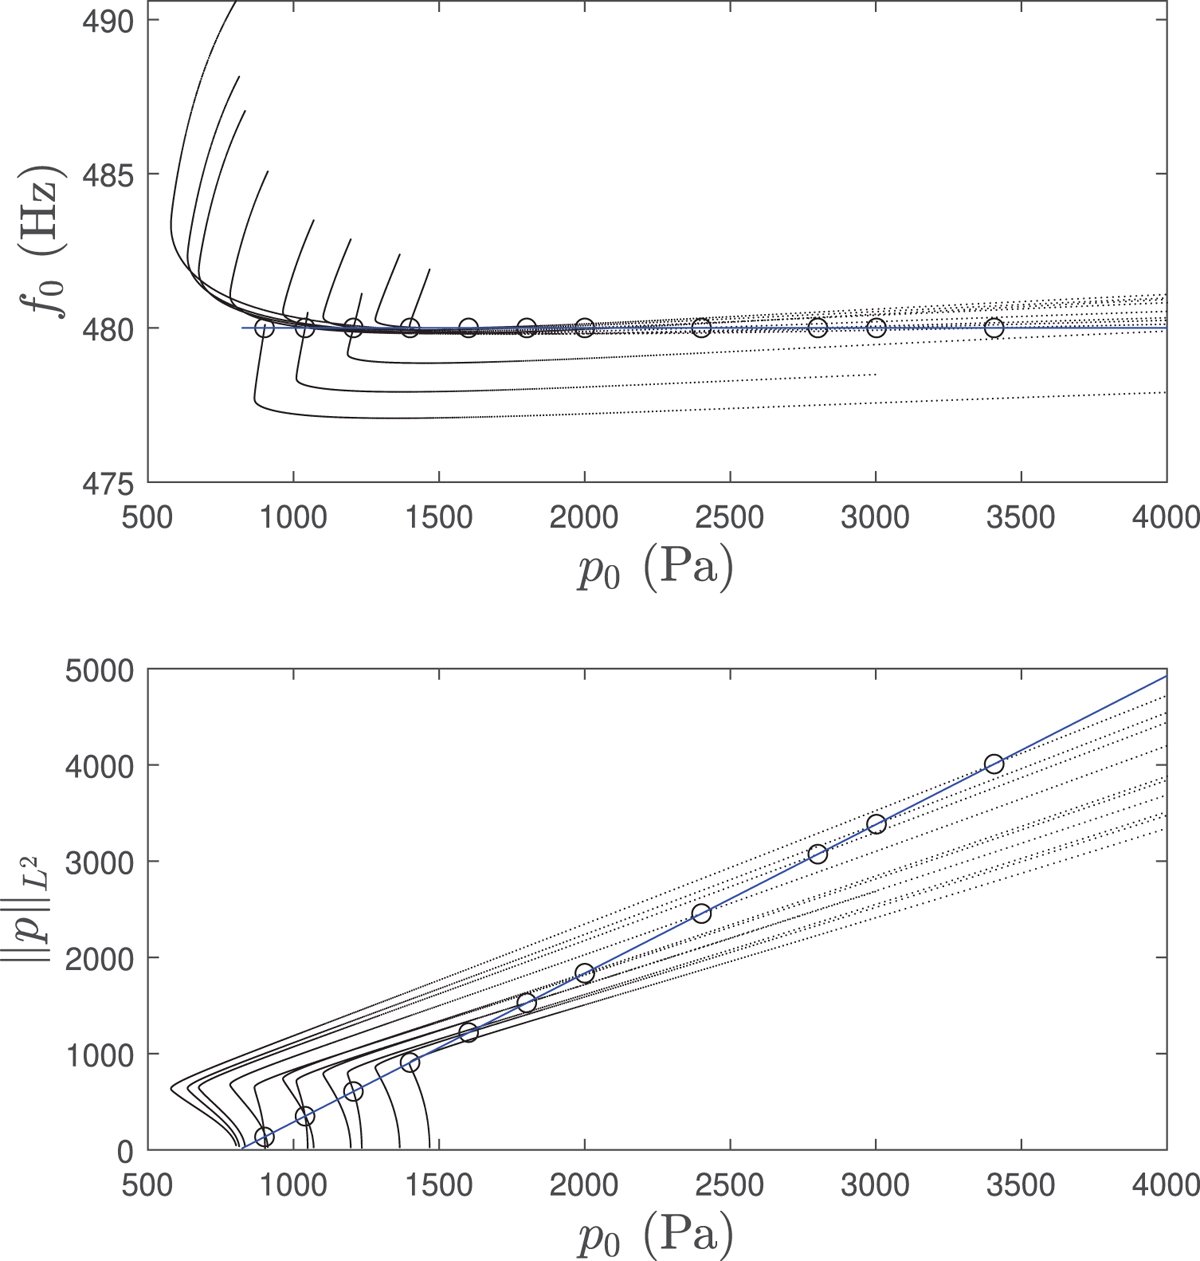
Bifurcation diagram with constraints (blue), overlapped with constant-parameter bifurcation diagrams where ζ and Ql are set to values obtained from constrained continuation. Circle markers indicate intersection points between the diagram with constraints and the constant-parameters diagrams.
Current usage metrics show cumulative count of Article Views (full-text article views including HTML views, PDF and ePub downloads, according to the available data) and Abstracts Views on Vision4Press platform.
Data correspond to usage on the plateform after 2015. The current usage metrics is available 48-96 hours after online publication and is updated daily on week days.
Initial download of the metrics may take a while.