Figure 14
Download original image
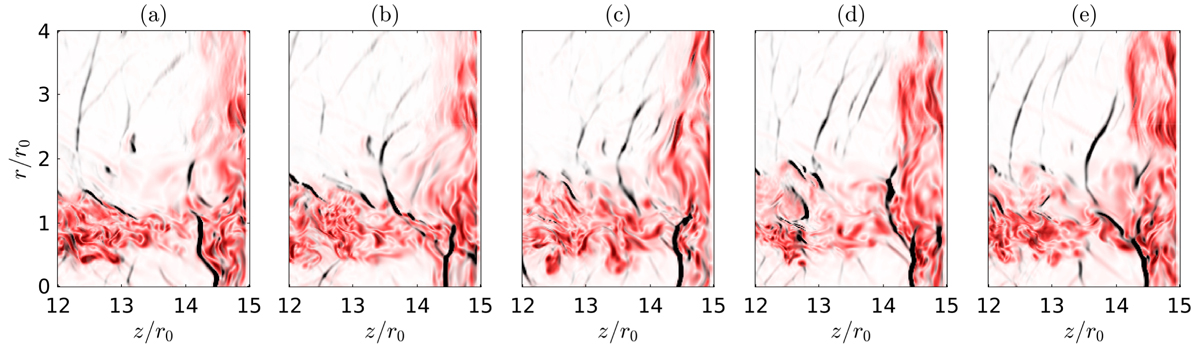
Fields of density gradient ∂ρ/∂z (black) and vorticity (red) near the plate for L = 15r0 at (a) t = 0, (b) t = 2.5r0/ue, (c) t = 5r0/ue, (d) t = 7.5r0/ue and (e) t = 10r0/ue. The color scales range from 0 to 4ρ0/r0 for the density gradient, from white to black, and from 0 to 7.5ue/r0 for the vorticity, from white to red.
Current usage metrics show cumulative count of Article Views (full-text article views including HTML views, PDF and ePub downloads, according to the available data) and Abstracts Views on Vision4Press platform.
Data correspond to usage on the plateform after 2015. The current usage metrics is available 48-96 hours after online publication and is updated daily on week days.
Initial download of the metrics may take a while.