Figure 3
Download original image
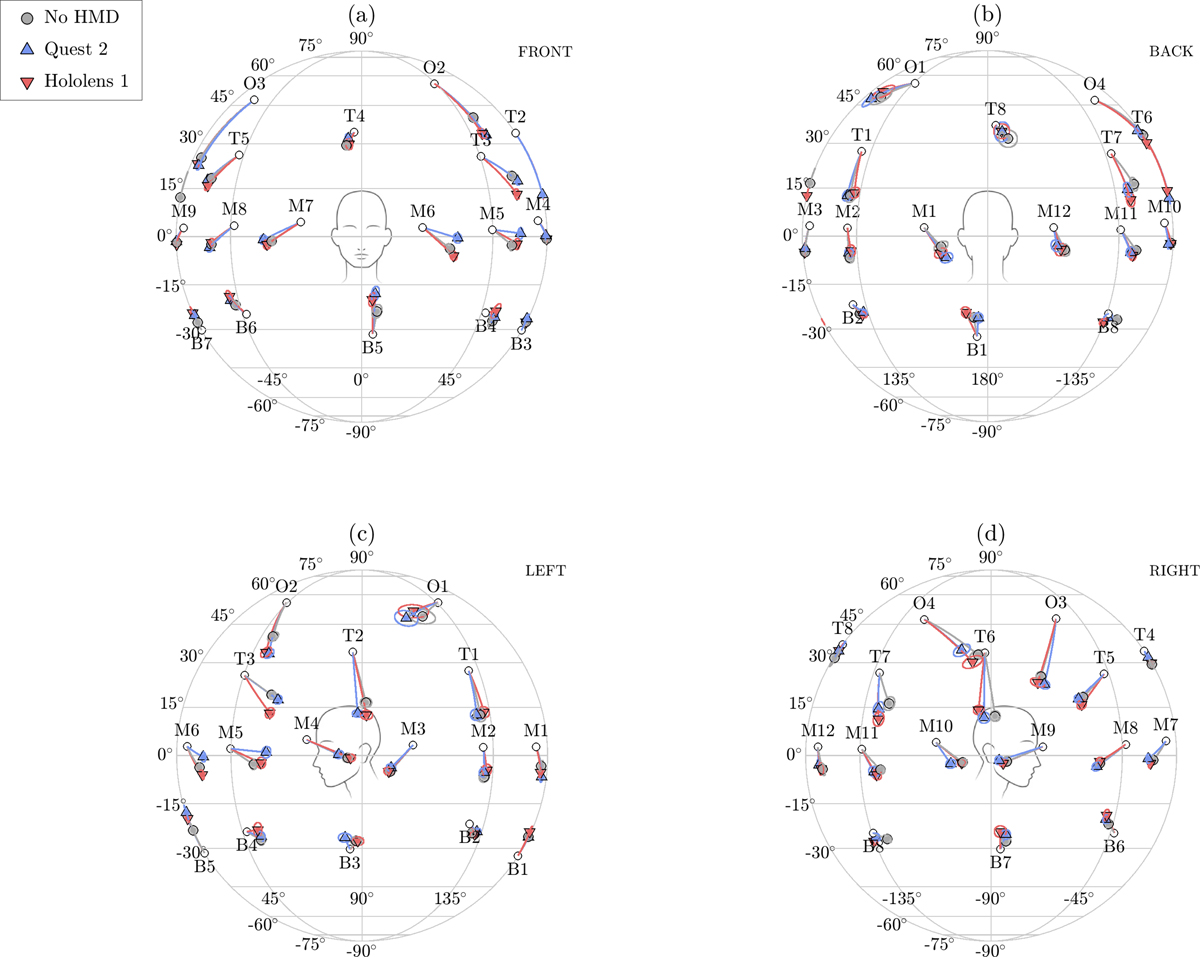
Average participant response locations for each HMD condition across speaker positions in the (a) front, (b) back, (c) left, and (d) right hemispheres. Only responses that fell within a 45° aperture cone around the actual source location are considered, discarding confusions to focus on local accuracy errors. Ellipses represent the standard error of the major and minor axes of the data variance obtained using the Kent distribution, after Leong and Carlile [13].
Current usage metrics show cumulative count of Article Views (full-text article views including HTML views, PDF and ePub downloads, according to the available data) and Abstracts Views on Vision4Press platform.
Data correspond to usage on the plateform after 2015. The current usage metrics is available 48-96 hours after online publication and is updated daily on week days.
Initial download of the metrics may take a while.