Figure 4
Download original image
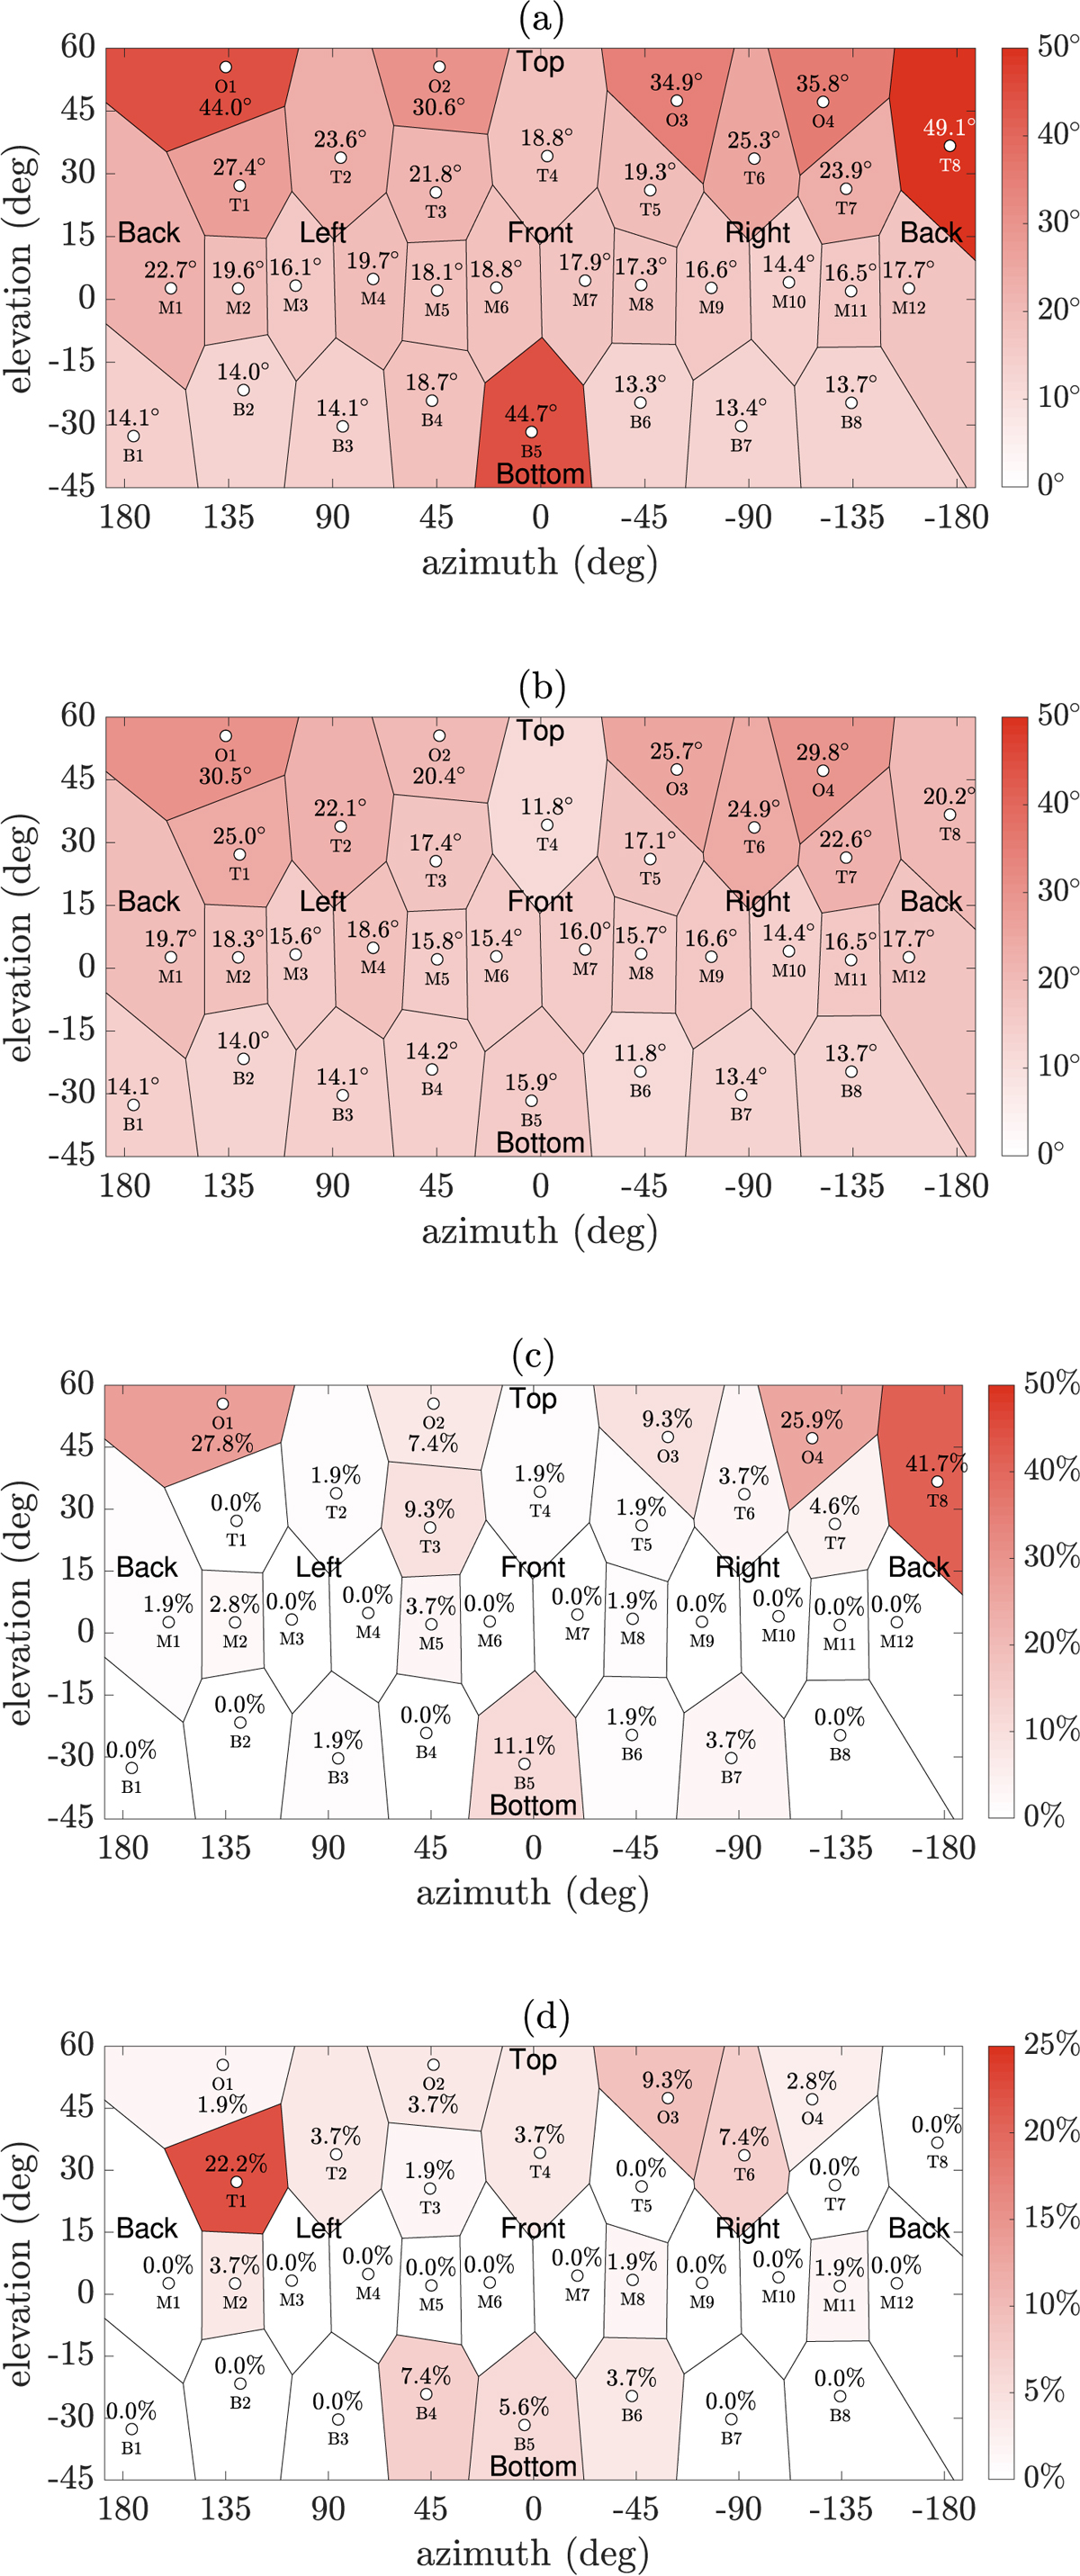
Localization performance across speaker positions, depicting (a) great circle angle error, (b) local great circle angle error, (c) front–back confusion rate and (d) up–down confusion rate for the No HMD condition. Metric values are reported above each speaker position (white circles), around which Voronoi cells have been drawn to simplify results interpretation. The apparent cell structure asymmetry is a result of the projection mapping inducing distortion at the poles (near ±90° elevation).
Current usage metrics show cumulative count of Article Views (full-text article views including HTML views, PDF and ePub downloads, according to the available data) and Abstracts Views on Vision4Press platform.
Data correspond to usage on the plateform after 2015. The current usage metrics is available 48-96 hours after online publication and is updated daily on week days.
Initial download of the metrics may take a while.