Figure 11
Download original image
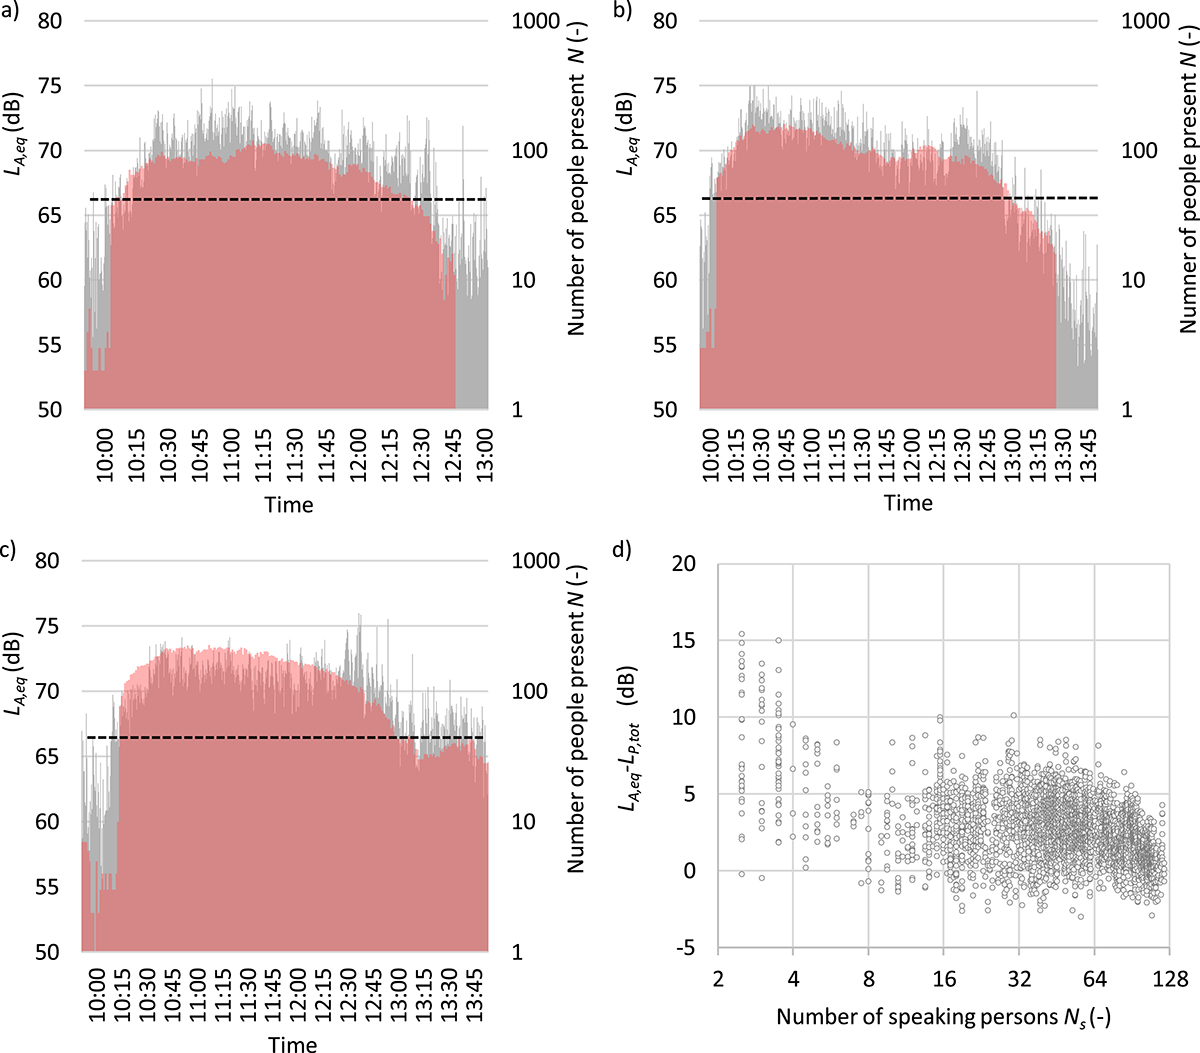
Time evolution of the noise level in STU-Bratislava student restaurant on Monday (a), Thursday (b) and Midday (c). The sound pressure level values are depicted in grey and the number of people present in pink. The acoustic capacity Nmax = 40, is indicated by the horizontal black dashed line In d), the difference LA,eq – LP,tot is plotted depending on the number of theoretically active sound sources, i.e. half of the persons present.
Current usage metrics show cumulative count of Article Views (full-text article views including HTML views, PDF and ePub downloads, according to the available data) and Abstracts Views on Vision4Press platform.
Data correspond to usage on the plateform after 2015. The current usage metrics is available 48-96 hours after online publication and is updated daily on week days.
Initial download of the metrics may take a while.