Figure 8
Download original image
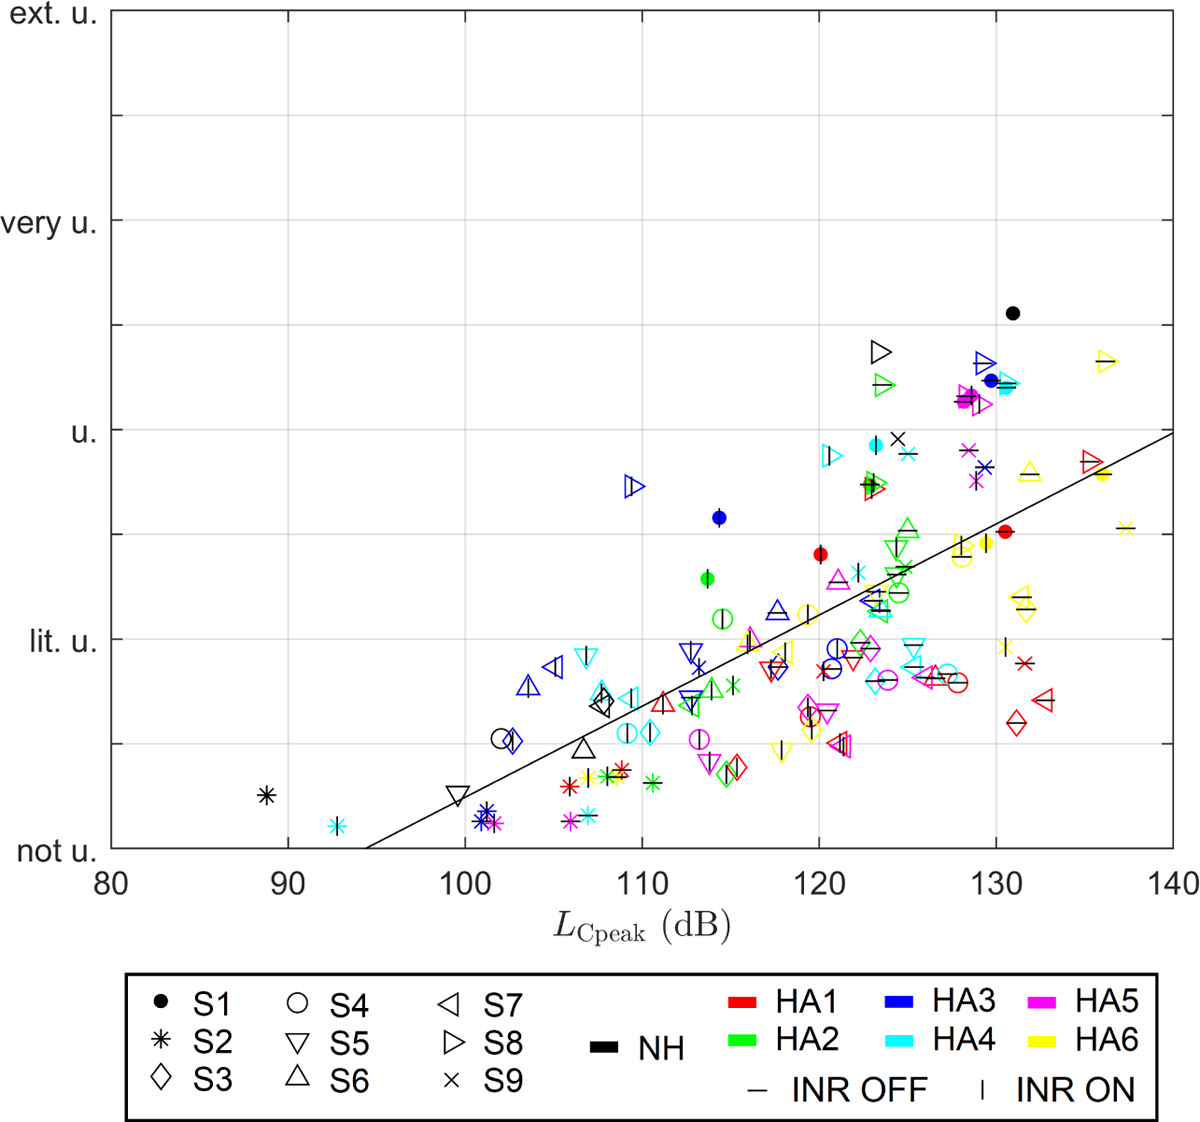
Scatter plot of the C-weighted peak sound pressure levels measured at the ear simulators of the HATS against the mean ratings of discomfort. The type of symbol indicates the type of stimulus. Black symbols correspond to the normal hearing test subjects (NH), and the values of the hearing impaired subjects are color coded depending on the type of hearing aid. Moreover, the settings of the hearing aids FIT INR OFF and FIT INR ON are marked with a horizontal (“–”) and vertical (“|”) black line, respectively.
Current usage metrics show cumulative count of Article Views (full-text article views including HTML views, PDF and ePub downloads, according to the available data) and Abstracts Views on Vision4Press platform.
Data correspond to usage on the plateform after 2015. The current usage metrics is available 48-96 hours after online publication and is updated daily on week days.
Initial download of the metrics may take a while.