Figure 8
Download original image
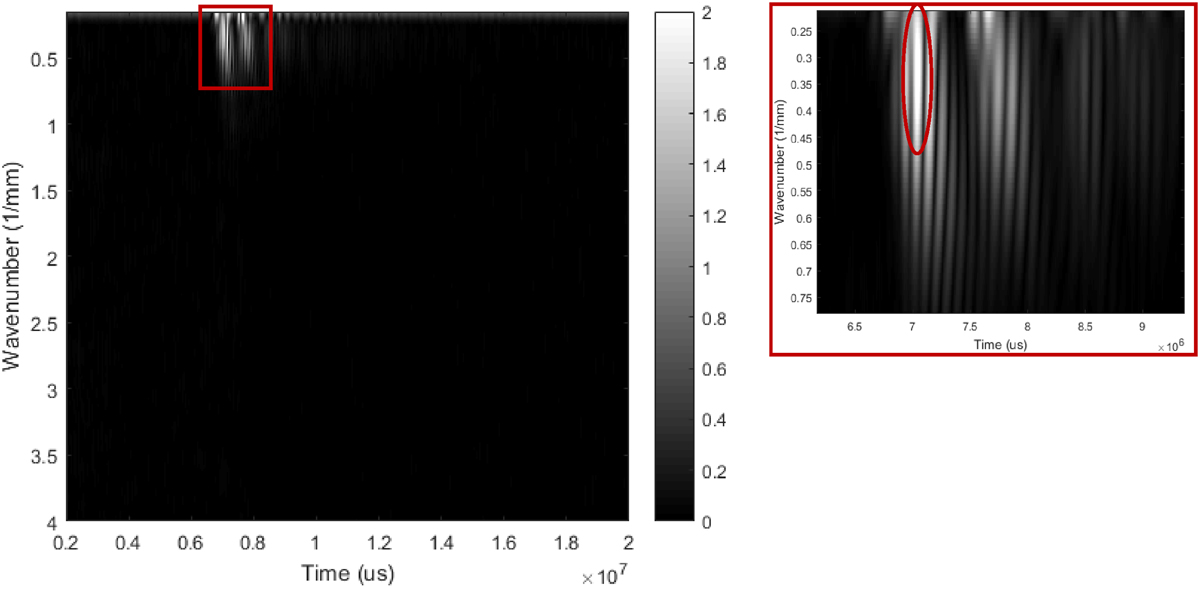
Spectrum in terms of pseudo-wavenumbers obtained by an FFT from the spatial domain at each instant. The example’s Ntpm = 29. A zoom-in of the boxed area is visible on the right. A maximum of energy can be seen at 0.314 ± 0.01 mm−1 resulting in a periodicity between 19.38 mm and 20.66 mm, in agreement with the expected 19.6 mm value in Table 1.
Current usage metrics show cumulative count of Article Views (full-text article views including HTML views, PDF and ePub downloads, according to the available data) and Abstracts Views on Vision4Press platform.
Data correspond to usage on the plateform after 2015. The current usage metrics is available 48-96 hours after online publication and is updated daily on week days.
Initial download of the metrics may take a while.