Figure 3
Download original image
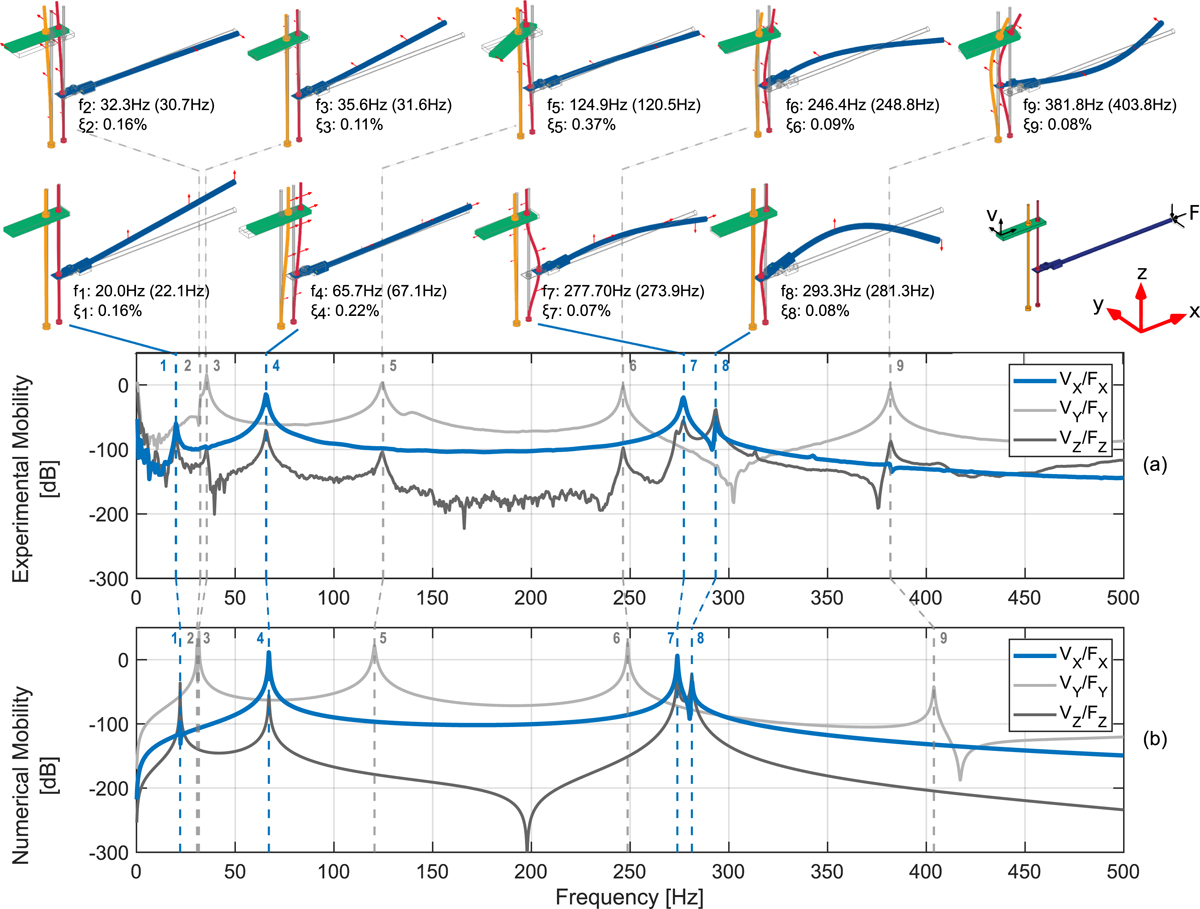
Experimental (a) and numerical (b) transfer-mobility between the point A and B. Respectively, the blue, light and dark gray correspond to the transfer-mobility in x-axis, y-axis and z-axis. Modes are numbered in order of appearance. Modal deformations are illustrated and their corresponding experimental eigenfrequencies (and numerical), and experimental modal damping ratios are noted.
Current usage metrics show cumulative count of Article Views (full-text article views including HTML views, PDF and ePub downloads, according to the available data) and Abstracts Views on Vision4Press platform.
Data correspond to usage on the plateform after 2015. The current usage metrics is available 48-96 hours after online publication and is updated daily on week days.
Initial download of the metrics may take a while.