Figure 5
Download original image
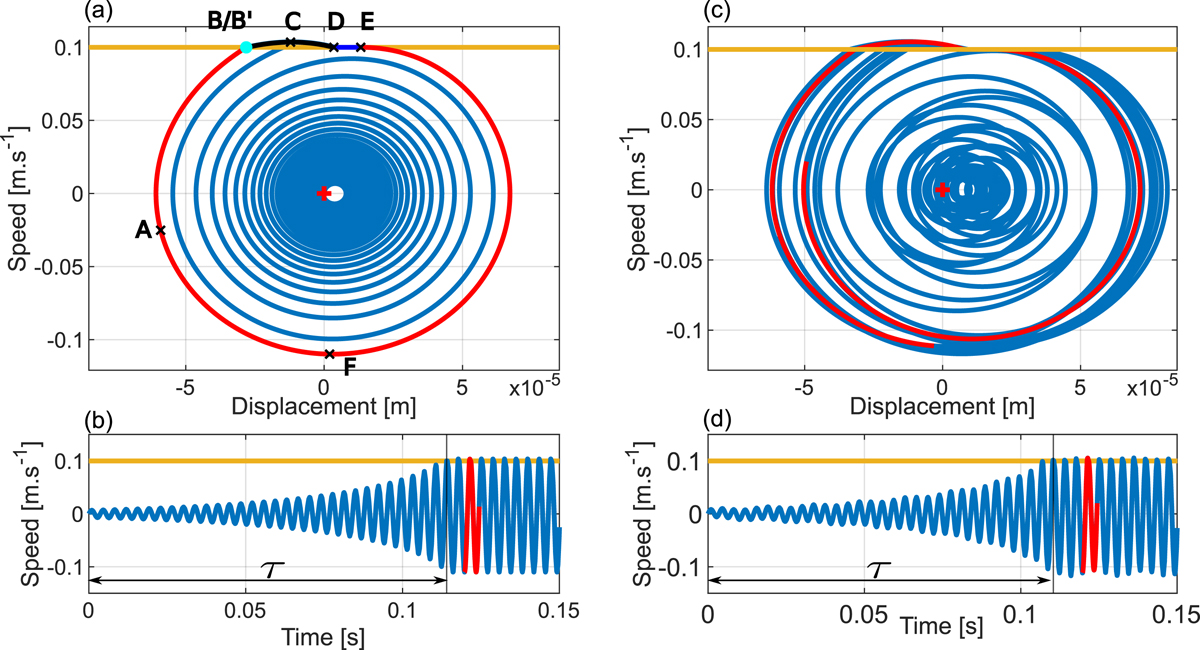
(a) and (b) are the time-response of the one-mode model to frictional excitation (![]() = 0.1 m.s−1 and FN = 1 N). (c) and (d) are the time response of the four-mode model (modes 1, 4, 7 and 8) to the same excitation. The orange lines correspond to the speed of the finger, the blue lines correspond to the resonator’s movement. (a) and (c) are phase diagrams, corresponding to speed versus displacement of the contact point C of the resonator; the red crosses show the starting point of the simulation: resonator at rest. (b) and (d) are speed versus time graphs, the vertical black lines correspond to the first instant where the speed of both resonator and finger are identical, the red curves correspond to approximately 1 period of the periodic regime. The seven instants (A–F) in (a) are the same as the Figures 4b, 4c and 4d.
= 0.1 m.s−1 and FN = 1 N). (c) and (d) are the time response of the four-mode model (modes 1, 4, 7 and 8) to the same excitation. The orange lines correspond to the speed of the finger, the blue lines correspond to the resonator’s movement. (a) and (c) are phase diagrams, corresponding to speed versus displacement of the contact point C of the resonator; the red crosses show the starting point of the simulation: resonator at rest. (b) and (d) are speed versus time graphs, the vertical black lines correspond to the first instant where the speed of both resonator and finger are identical, the red curves correspond to approximately 1 period of the periodic regime. The seven instants (A–F) in (a) are the same as the Figures 4b, 4c and 4d.
Current usage metrics show cumulative count of Article Views (full-text article views including HTML views, PDF and ePub downloads, according to the available data) and Abstracts Views on Vision4Press platform.
Data correspond to usage on the plateform after 2015. The current usage metrics is available 48-96 hours after online publication and is updated daily on week days.
Initial download of the metrics may take a while.