Figure 2
Download original image
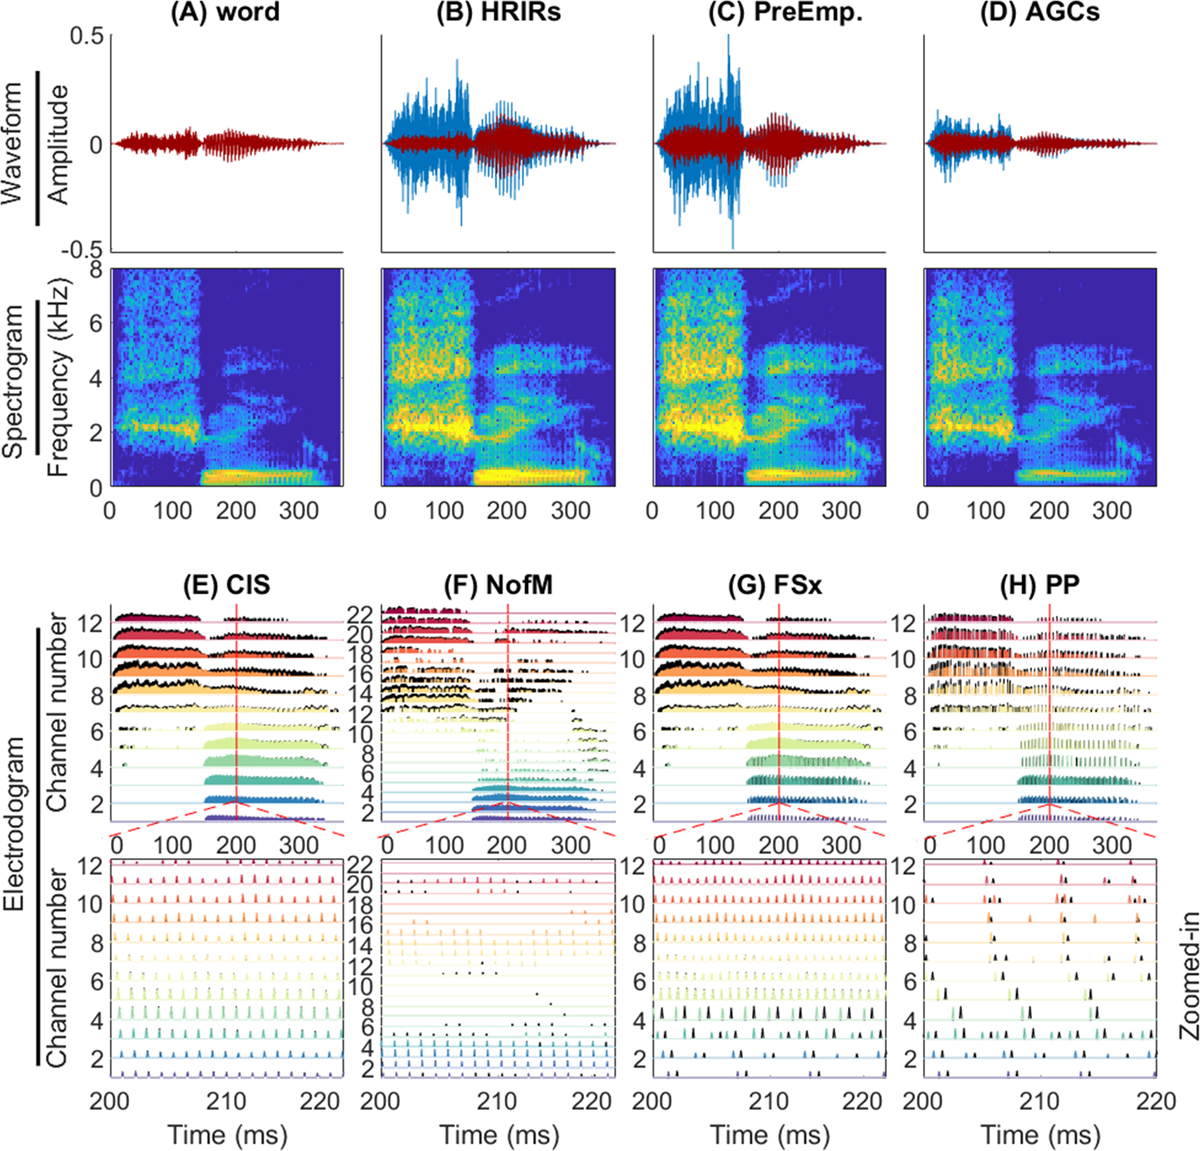
Illustration of input signal and cochlear implant (CI) processing. (A) Single word stimulus at 60 dB SPL. (B) Stimulus output after applying head-related impulse response (HRIR) of azimuth −60°. (C) Stimulus output after pre-emphasis. (D) Stimulus output after applying two independent automatic gain controls (AGCs). Blue and red traces represent the left and right channels, respectively. The corresponding subplots in the second row display spectrograms of the left channel signal. The electrodograms resulting from applying the four exemplary coding strategies to the stimulus outputs depicted in panel D are shown in column E to H. (E) 12-channel gammatone filter banks based continuous interleaved sampling (CIS). (F) 8-of-22 channel Fast Fourier Transform (FFT) filter banks based CIS. (G) FSx = 4 strategy. (H) Peak picking (PP) strategy. The bottom subplots in Figures 2E–2H present zoomed-in plots between 200 and 220 ms within the narrow red rectangular at the red line. The electrodogram for the left CI is shown in black, while color-coded traces represent the electrodogram for the right CI.
Current usage metrics show cumulative count of Article Views (full-text article views including HTML views, PDF and ePub downloads, according to the available data) and Abstracts Views on Vision4Press platform.
Data correspond to usage on the plateform after 2015. The current usage metrics is available 48-96 hours after online publication and is updated daily on week days.
Initial download of the metrics may take a while.