Figure 6
Download original image
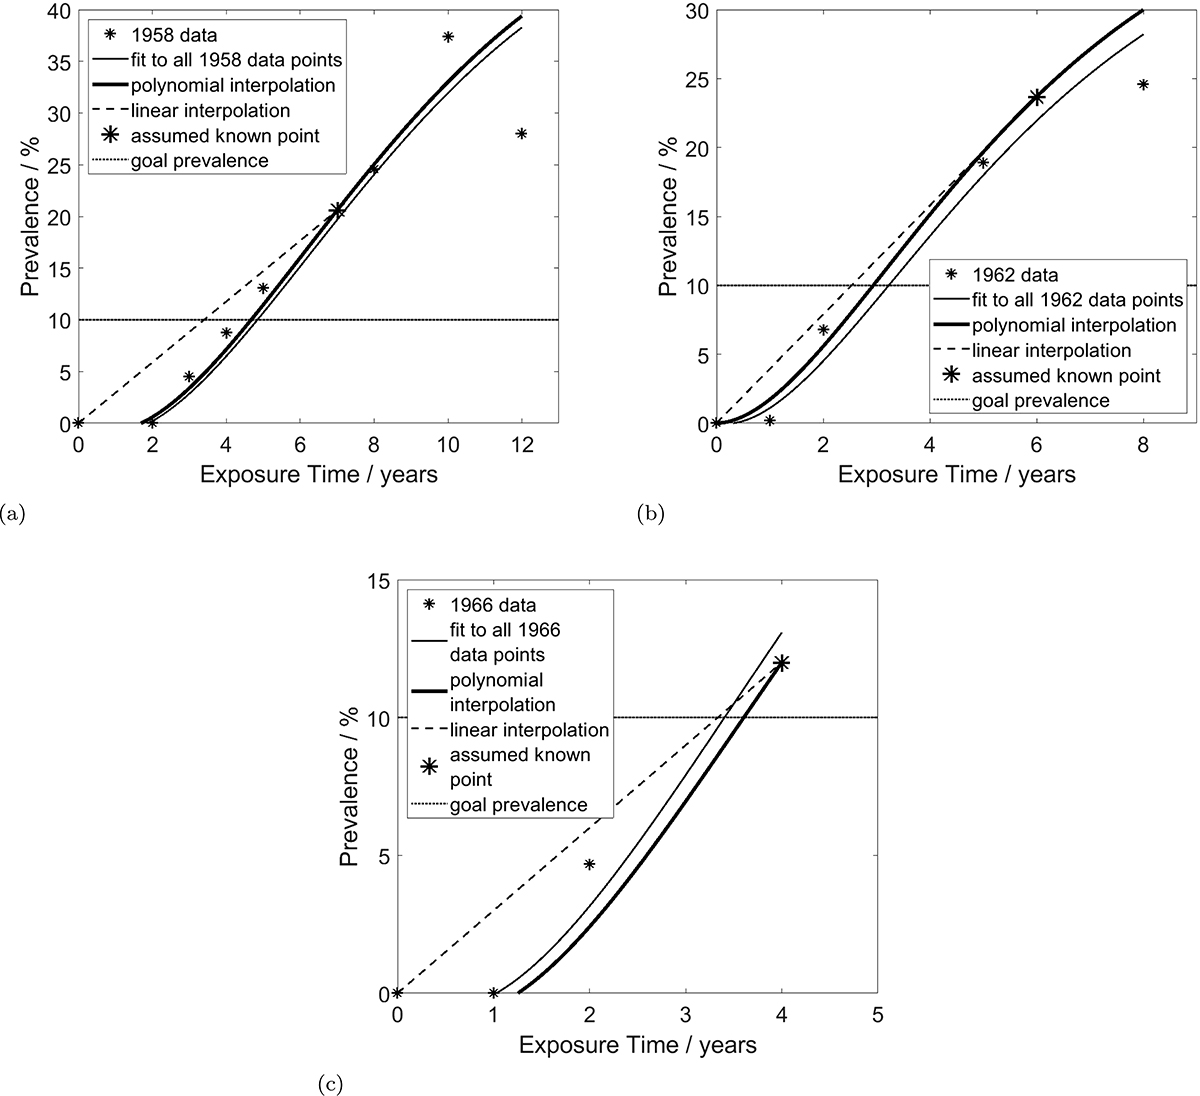
Point prevalence of vibration-induced white finger (VWF) as a function of exposure time. The data sets from Futatsuka and Ueno [26] are shown as small asterisks, the fits to the respective data sets from Section 3.3 as a thin line and the assumed known data point from which to estimate the exposure time to reach 10% prevalence as a large asterisk. Linear interpolation from the assumed known data point is shown by the dashed line and polynomial interpolation using equation (4) up to the 4th-order with the respective parameter values from Table 1 by the thick line. The prevalence of interest (10%) is shown by the horizontal dotted line.
Current usage metrics show cumulative count of Article Views (full-text article views including HTML views, PDF and ePub downloads, according to the available data) and Abstracts Views on Vision4Press platform.
Data correspond to usage on the plateform after 2015. The current usage metrics is available 48-96 hours after online publication and is updated daily on week days.
Initial download of the metrics may take a while.