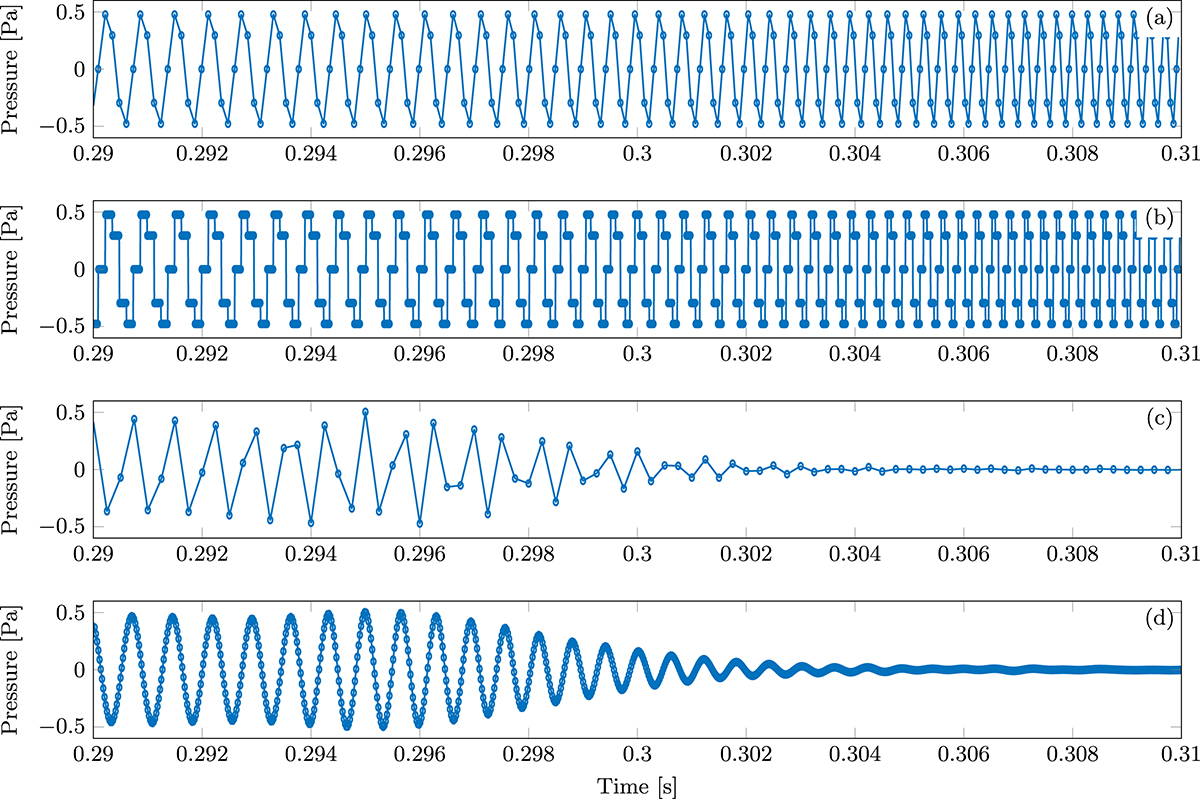
Figure 6

Download original image
Snapshots of signals obtained from different points along the NOTAP signal path used to generate Figure 5g (ZOH, N = 500). (a) Transmitted acoustic pressure with non-uniformly spaced samples, px (b) The ZOH interpolation of, po (c) Decimation of (b) to fs,r = 4 kHz and applying time-varying anti-imaging filter, pr, (d) Upsampled version of (c) to a listening sampling frequency of 44.1 kHz.
Current usage metrics show cumulative count of Article Views (full-text article views including HTML views, PDF and ePub downloads, according to the available data) and Abstracts Views on Vision4Press platform.
Data correspond to usage on the plateform after 2015. The current usage metrics is available 48-96 hours after online publication and is updated daily on week days.
Initial download of the metrics may take a while.


