| Issue |
Acta Acust.
Volume 9, 2025
|
|
|---|---|---|
| Article Number | 22 | |
| Number of page(s) | 14 | |
| Section | Environmental Noise | |
| DOI | https://doi.org/10.1051/aacus/2025006 | |
| Published online | 13 March 2025 | |
Technical & Applied Article
Method of satisfaction based on-board acoustic comfort classification and its applications
School of Marine Science and Technology, Northwestern Polytechnical University Xi’an 710072 P.R. China
* Corresponding author; This email address is being protected from spambots. You need JavaScript enabled to view it.
.
Received:
13
January
2024
Accepted:
4
February
2025
Abstract
Acoustic comfort is an important factor that passengers and crew usually consider for their on-board wellness. The classification is an efficient way to show the level of acoustic comfort on board. Most of the existing classification approaches of on-board noise in different spaces are based on the decibel based indicators which describes the loudness. However, acoustic comfort is not only relevant to decibel based indicators but also perceptual attributes such as timbre and pitch. In order to provide more perceptual support, a satisfaction based classification method for acoustic comfort is modified, determining the limits of the noise in different task-oriented spaces on board. Perceptual assessments were carried out to obtain numerical values for acoustic comfort as noise comfort index (NCI) and measured satisfaction (SM) of each noise sample. Analysis made on these two descriptors indicated that the NCI has a strong relationship with SM. Therefore, satisfaction can be regarded as a basic perceptual guideline to classify the acoustic comfort and determine the limits of each level for each task-oriented space. A linear acoustic comfort model was established to predict the NCI based on the acoustic parameters. Comparison with the previous classification of on-board noise showed that there is a mismatch between the NCI and sound pressure level (SPL), and NCI can not be fully represented by SPL.
Key words: Acoustic comfort / Satisfaction based on-board noise / Perception
© The Author(s), Published by EDP Sciences, 2025
 This is an Open Access article distributed under the terms of the Creative Commons Attribution License (https://creativecommons.org/licenses/by/4.0), which permits unrestricted use, distribution, and reproduction in any medium, provided the original work is properly cited.
1 Introduction
The objective physical parameters or metrics for sound characteristics are usually based on sound pressure. However, the perceptual features of the real-life sound are extremely different. The perception is also effected by features such as timbre and pitch. Consequently, the traditional indicators based on SPL such as A-weighted sound pressure level (LA), can no longer be representative of the human perception.
In recent years, a sense of comfort is becoming one of the essential aspects in the acoustic environment classification [1, 2]. The acoustic comfort is defined as “a state of contentment with acoustic conditions” by Navai and Veitch in 2003 [3]. The acoustic comfort has been used in many aspect as a condition for whether the acoustic environment is comfortable for people or not, but in different approaches, such as onboard ship noise which focus on the spectral components [4, 5] and the Yacht interior noise which attempted classify the reverberation time [6]. The sense of acoustic comfort is related to the acoustic environment and includes subjective perceptions from the source of sound to the synthesis of sound space. Based on the sense of comfort, Rocca et al. [7] had a summary on three categories of existing indicators evaluating the acoustic comfort in indoor environment, one involves sound insulation of buildings such as Acoustic Performance index, Weighted sound reduction index and etc., another is related to the noise perceived within the environment such as A-weighted continuum equivalent sound pressure level, Zwicker's loudness level and etc., final one is concerned with acoustic quality in spaces such as Clarity index, Early decay time and etc.
As shown above, the mentioned existing indicators of the acoustic comfort evaluation on board are usually based on or related to physical parameters of the sound or the acoustic environment. However, the perception is also effected by features such as timbre and pitch. Consequently, the existing indicators can no longer be representative of the human perception [8–10]. The attention must be paid to the acoustic comfort as an composite factor that passengers and crew usually consider for their on-board wellness, especially for the leisure boats such as cruise ships. Therefore, an composite acoustic descriptor that can describe the comfort level of the acoustic environment as a subjective metric is proposed in this paper.
Besides the indicators and descriptors, the classification scheme and limit values for difference spaces are also need to be discussed. Rocca et al. [7] had a table of European countries acoustic classification scheme for dwellings. Most of them had 4 or 5 levels. And also had a list that shows the latest versions of the guidelines analyzed and the relative comfort ratings. Most of them had 3 levels. They also mentioned about the limit values for difference spaces. The limit values were described as A-weighted SPL.
Most of the existing standards and papers about the classification of on-board noise had an unclear criterion on why and how to divide these metrics into different classes. And also they involved in little human perception on the space classification. It is still a lack of the availability for an evaluation that can describe how people feel on board in different accommodation spaces.
In order to make the acoustic environment classification on board more intuitively related to auditory perception, a classification of the acoustic comfort on board based on the satisfaction is put forward. A clear criterion based on the satisfaction of the human perception is described. It can provide more human-centred approach care with perceptual support.
In the boat sector, the most important guidelines indicating the requirements and the acoustic classification for yachts only take into account few indicators, such as the L Aeq and some passive acoustic requirements of internal structures such as impact sound insulation level. On the one hand, indicators are required to describe the acoustic comfort based on the perception. On the other hand, classifications are necessary to show the level of acoustic comfort. Therefore, a method that based on the satisfaction to classify the acoustic comfort of on-board spaces is proposed. In this study, a composite acoustic comfort indicator is obtained and its prediction model is established. The classification criterion for the acoustic comfort is introduced based on the satisfaction. The criterion has two parts, one is for classifying the acoustic comfort, another is for classifying the on-board space acoustic comfort. And the application of this classification method is discussed.
2 Material and methods
There are ten descriptors and indicators being involved or put forward in this study. They are shown in the following Definition part. The purpose of the method in this study is to get the acoustic comfort limits for each space on board, and the application is to obtain the classification of each space on board.
2.1 Indicators and NCI model
There are 4 indicators for evaluating the acoustic comfort through 3 different experiments, including annoyance, comfort index, measured satisfaction and expected satisfaction. Based on the comfort index and measured satisfaction, a fitted line which describes the relation between the sense of comfort and satisfaction is obtained. At last, 2 indicators of acoustic comfort limits are obtained. The above 7 definitions are for the introduction of the method. The rest 3 definitions are for the application which shows how to get the classification level for each space on board based on the collected sound samples. Therefore, it includes the acoustic model to calculate the comfort index based on the acoustic parameters of sound samples and the final space classification.
In order to have an initial understanding of this method, some terms are shown as below. The (1)–(7) are for the introduction of the method and (8)–(10) are for the application of the method.
-
(1)
Noise annoyance
Noise annoyance (NA) is a subjective metric describing how annoying the noise is. NA was obtained through a subjective experiment which was performed in the laboratory setting. The subjects scored each sound sample according to the question of “how annoying the noise that you are listening now is compared with two reference samples”. According to ISO15666-2021 the scoring scale is 0–10, 11 levels [11]. As shown in Table 1, zero means “not annoyed at all” and ten means “extremely annoyed”. The scoring also based on two reference samples. The reference samples are two samples of all samples which has the lowest SPL (representing for NA=0) and highest SPL (representing for NA=10), respectively.
-
(2)
Noise comfort index
Noise comfort index (NCI) with scale of 0–100 is a subjective metric firstly obtained through the noise annoyance-based expression to describe how comfortable the noise is, and it can be calculated by the annoyance with the scale of 0–10, as shown in equation (1). Then, for applications, a model is built to predict NCI based on acoustic parameters of the noise sample. Such a model is introduced in the Section 3.2.2.
 (1)
(1) -
(3)
Measured satisfaction
Measured satisfaction (SM) is one of the satisfaction indicators and a subjective metric describing how satisfying the noise in one specific space. SM is obtained by a subjective experiment which is performed in the laboratory setting. The spaces on the ship are divided into the passenger area and the crew area. Because different need of two kinds of acoustic environment leads to two different scales. Therefore, the experiment is divided into two part for the passenger area and the crew area. The subjects scored sound samples from each area based on the question of “how satisfying the noise that you are listening now is compared with two reference samples”. As shown in Table 2, the scoring scale is 1–5, 5 levels. One means “extremely satisfying” and five means “not satisfying at all”. The reference samples are two samples from each area which has the lowest SPL (representing for 1) and highest SPL (representing for 5), respectively.
-
(4)
Expected satisfaction
Expected satisfaction (SE) is another satisfaction indicator describing how satisfying the noise that subjects expect in the certain spaces is and a subjective metric obtained by questionnaires. The questionnaires that for the passenger and the crew are shown in the Appendix A. Each subject as either a passenger or a member of the crew, scores corresponding spaces in one area only. The scoring scale is shown in Table 2.
Table 1The scale of noise annoyance.
Table 2The scale of the satisfaction.
-
(5)
NCI-S line
A line describes the relation between NCI and satisfaction. Each sample has a SM and an NCI. Taking SM as the abscissa, NCI as the ordinate, draw a scatter plot of the passenger and the crew area, respectively. The points are fitted first-order to form the NCI-S line. Since SM is divided into the passenger and the crew part, there are two lines. Each line has an expression.
-
(6)
The limits of the NCI
Each level of the SM corresponds a NCI scale and to two NCIs based on the expression of each NCI-S line (When S=SM, NCI can be calculated). That means each level of satisfaction has an NCI scale and two corresponding NCIs. The corresponding NCIs are the limits of the NCI (LN).
-
(7)
The space limits
Each space has a SE and this SE level of satisfaction has an NCI scale and two corresponding LN. The two corresponding LN are the space limits (LS).
The above definitions are for the method and the following definitions are for the application.
-
(8)
NCI model
A linear regression model based on acoustic parameters of the sound samples as the input, and the NCI as the output (independent and dependent variables). This acoustic comfort model is the NCI model.
-
(9)
The calculated NCI
The calculated NCI (NCIC) is the NCI value calculated based on the NCI model.
-
(10)
Space classification
The two LS divide the whole NCI (0–100) into three scales, representing for three levels to describe “very satisfied”, “just satisfied” and “not satisfied at all” for each space. To see which scale that NCIC is in the corresponding level is Space classification (CS).
2.2 Methodology
The framework of satisfaction based acoustic comfort classification is emphasized and shown in the Figure 1. Each key step is explained and specified in the following. And each corresponding definition is labeled in accordance with definitions in Section 2.1.
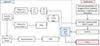 |
Figure 1 Approach and application of this classification. |
Based on the above definitions, the method is introduced in the following steps.
-
(1)
First, record samples in the appropriate places and calculate the acoustic parameters including A-weighted sound level and psychoacoustic parameters [12] of each sample.
-
(2)
Then an annoyance experiment (subjective experiment 1) is conducted in the laboratory setting. The scale of the NA is 0–10, 11 levels. During the subjective listening experiment, all samples are scored within the scale as the NA by each subject. The average of the annoyance values from the subjects of each sample is the NA of this sample. Based on the NA, the NCI can be calculated.
-
(3)
The satisfaction experiment (subjective experiment 2) is carried out after the subjective experiment 1 with the same laboratory setting and subjects to get the SM. The scale of the SM is 1–5, 5 levels. The subjective listening experiment for SM is divided into two parts based on the passenger and the crew area. During the subjective listening experiment, all samples are scored within the scale as the SM by each subject. The average of the SM values from the subjects of each sample is the SM of this sample.
-
(4)
Take SM as the abscissa, NCI as the ordinate, first-order fitting these dots, then two NCI-S lines and expressions can be obtained. The NCI-S expression is represented for the absolute and objective relationship between the satisfaction and NCI. Therefore, based on this expression, each level of satisfaction has a corresponding NCI which is the LN.
-
(5)
The SE is obtained by questionnaires. Questionnaires have two parts for passengers and crew, respectively. Two different groups of people answer these two parts based on their expectations for this space. The scale of the SE is 1–5, 5 levels. The SE depends on the features of this space. And SE describes the acoustic satisfaction of the space among the spaces.
-
(6)
The SE of each space is the bridge to determine the corresponding pair of limits. And this pair of limits is the limits of each space classification. Based on these two limits, space classification is a 3-level. The middle classification of one space, represents for “just satisfied”. The corresponding scope of NCI is the limit of classification of “just satisfied”. This scope contains two values of comfort index as LS, the smaller one means the least limit of “just satisfied” the bigger one means the top limit of “just satisfied”. The classification below the least limit of “just satisfied” is “not satisfied at all”. The classification above the top limit of “just satisfied” is “very satisfied”.
The following comes to the brief introduction of the application.
-
(7)
Based on acoustic parameters, an NCI model is established to calculate the NCIC.
-
(8)
Based on the NCIC, each space has a 3-level classification which is CS, representing for the acoustic comfort level among this whole area.
It is noted that neither the method nor the application involves the content of which level is qualified. It is beyond this paper.
3 Method of classification
3.1 Test case and procedure
An experimental campaign has been carried out on a cruise ship, during a steady navigation in calm sea conditions.
3.1.1 Collection objects
The ship is a Ro-Pax vessel, designed by China independently for transportation of passengers and vehicles. Six lower garage decks and four upper decks for public spaces and accommodations of passengers and crew are featured. The capacity is of about 350 cars, 1689 passengers and 93 crew members. Spaces classified by China Classification Societies (CCS) is shown in Table 3. Spaces are divided into two parts for passengers or crew depending on the usage and function of the room.
The types of spaces.
3.1.2 Equipment
The equipment used for the survey is composed by a portable multi-channel noise and vibration measurement system, SA-A1, equipped with a RION UC-59 microphone.
The microphones were hold by hands on each side of the body at two height 1.2 m and 1.6 m for noise measurement at each testing point and more than 0.5 m from any boundary surface of the space examined to limit the reflection. The distance between each two testing points were at least 2 m. The sampling rate is 51 200 Hz and each sample lasts for 20 s.
3.1.3 Measurement in stationary conditions
The measurements during navigation have been carried out, according to the provisions of the IMO Noise Code, with the main propulsion machinery running at normal design speed. The ship was in loaded condition and all the auxiliary machinery, navigation instruments, radio and radar sets were normally in use.
Only necessary crew members and testers are allowed to be in the testing spaces. The noise that has nothing to do with the navigation or the features of this space was limited to a minimum.
The testing points were selected from all the places which are shown in Table 3. These places have different kinds of functions and characteristic. The testing points had been planed to be 147 before we got on the ship. Each point corresponds two noise samples recorded at 1.2 and 1.6 m of height. But actually, there were only 236 sound samples were successfully recorded from 118 points due to the time limit. We did not listen to every sample until finishing and being back from the acquisition, and found out there were 33 samples being not recorded successfully because of some interruptions in the sound samples. These samples were not appropriate to playback for the subjects during the subjective experiment. Therefore, there were 203 sound samples for the subjective experiment.
3.1.4 Analysis
To build the relation between the acoustic parameters and the objective descriptor, acoustic parameters are calculated for each sound sample including LA, loudness, sharpness, roughness and fluctuation. The calculation reference of these parameters are mentioned in Section 3.2.2.
3.2 The experimental procedure
The way of getting the acoustic comfort and satisfaction indicators is shown in Figure 2. There are 3 experiments in total. Two of them are subjective experiment based on the listing experiment, another one is an online experiment based on questionnaires. Subjective experiment 1 is to get the NCI of all samples. Subjective experiment 2 is to get the measured satisfaction of both passenger and crew area. Both experiments have the same laboratory settings and subjects. Subjective experiment 2 was carried out after finishing the experiment 1. The online experiment is to obtain the SE of both passenger and crew area and carried out during the two subjective experiments.
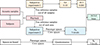 |
Figure 2 Procedure of the experiment. |
3.2.1 Subjective experiment 1: NA and NCI
The subjective experiment 1 is carried out by playing back the sound samples through headphones for 24 Chinese subjects (12 males and 12 females with age distribution of 18–40 years). The subjects were native Chinese speakers. The hearing threshold levels of all participants were tested using an audiometer for all frequencies (0.5, 1, 2, 4 and 8 kHz), and it was found that all subjects had normal hearing. All subjects were recruited to participate in subjective experiment 1 and 2 in a paid way.
There are 203 samples being played back for the subjects. For the subjective listing experiment, the level of samples was in the appropriate scope. After listening to those samples with a high level, set six of them to 75 dB(A). Therefore, the limiting level of all samples are 31 dB(A) and 75 dB(A). In order to obtain the annoyance of each acoustic sample from specific space of the ship, a subjective experiment is lunched. The 31 dB(A) sample regarded as score 0 and the 75 dB(A) sample regarded as score 10 are trained to the subjects as the reference samples. During the subjective listening experiment, all samples should be scored within the scale according to the annoyance feelings of each sample and those two reference samples as the annoyance value for each sample.
The play back devices are Artemis binaural headphone equalizer (HEAD lab-compatible binaural headphone equalizers labP2) and dynamic Hi-Fi stereo headphones (Sennheiser HD600). The software is ArtemiS suite. A meeting room is selected as the listening room in which background noise is 41.7 dB(A) measured by the portable acquisition device SQuadriga III with the binaural microphone BHS II. No other noise can be heard after wearing the headphones. Therefore, it is suitable for the listening test as a listening room. The picture of the subjective experiment is shown in Figure 3.
 |
Figure 3 Picture of the subjective experiment. |
Before the subjective experiment, the background and notifications are emphasized to subjects and those two reference samples are played and explained. During the subjective experiment, each pair consist of one 5 s sample for subjects to feel and a 5 s blank for subjects to score. All samples are played randomly and one by one. The reference samples are played as a reminder in between about every 10 samples. For the recovery of hearing and feelings, a break for few minutes is taken every 20 min of the experiment.
In order to ensure the accuracy of the results, the validity of the data is verified. Two analyses are carried out, i.e. analysis of correlation and analysis of misjudgment. About 30% of 203 samples (61 samples) were selected randomly and repeated for the 24 subjects after the above experiment to form the second set of annoyance data. Analysis of correlation was carried out between the second set data of 24 subjects and the corresponding data in the first set, that is, two sets of ratings obtained by the same subject evaluating the same sound samples. The ratings had good consistency, and all the results from subjects who has a correlation coefficient (Pearson correlation coefficient) lower than 0.7 (P value < 0.1) were excluded. In fact, a certain difference between the results of repeated evaluations of the same sample by the same subject should be allowed, as long as the probability of the difference exceeding a certain value is lower than the significant level of the acceptability test. Therefore, analysis of misjudgment was carried out between the second set data of 24 subjects and the corresponding data in the first set. If the difference between the two ratings is greater than 2, it is regarded as an impermissible misjudgment. If the misjudge rate of each subject was greater than 0.3, all the results from this subject was excluded. After the data analysis, there were 8 subjects being excluded. The average scores of the rest is the final annoyance of this sound sample. Based on the NA, the NCI can be calculated by equation (1) in Section 2.1.
3.2.2 Subjective experiment 2: SM
The process, the laboratory setting and subjects of the subjective experiment 2 are the same as that of the subjective experiment 1. But the samples, the scoring scale and the reference samples are different from the subjective experiment 1. The samples are divided into two groups based on where the samples are recorded. According to the places that are for passengers and crew, two groups of samples are divided from all samples. There are 149 samples from the passenger spaces being considered as group 1, and 77 samples from the crew spaces being considered as group 2. Some spaces are for both passengers and crew, so some samples are in both groups. And the scoring scale is 1–5. The reference samples are the samples of the lowest level and the highest level chosen from each group as the score 1 and 5. The group 2 was played for the same subjects after the group 1.
After the same data analysis, there was one subject being excluded. The average score of the rest subjects is the final of this sound sample.
3.2.3 The SE
Questionnaires with two parts for passengers and crew are shown in the appendix. The online questionnaires were sent to the Chinese people who are or were the crew as the crew and people who are not or were not the crew as the passengers during the subjective experiment. They were all native Chinese speakers. The people who answered the questionnaires are not the same as the subjects in the subjective experiments. Scoring 1 for “most satisfied”, scoring 5 for “not satisfied at all” and “Hard to judge” for “can not judge”.
There are 77 responses of passengers and 52 responses of crew. The ones that chosen randomly respond the passenger part only and the ones who have the working-on-ship experience as the ones who respond the crew part only.
Based on the cluster analysis, some outliers and blanks are eliminated. There are 63 responses of passengers and 44 responses of crew preserving as the valid results. The average and mode are calculated based on the valid results. The expected satisfaction is to describe the threshold of the satisfaction of one space, therefore the bigger values between average and mode of one space is the SE of this space. The results are shown in the next section.
3.3 The analysis of the results
The results of the NCI and SM can be concluded and shown as the NCI-S line. The results of SE are shown.
3.3.1 The NCI-S line
Taking SM as the abscissa, NCI as the ordinate, based on the NCI and SM of each sample, a scatter plot can be obtained. The NCI-S line and its expression can be obtained by first-order fitting these dots which is the most obvious and direct way to show the relation. The relations in passenger and crew areas are shown in Figure 4.
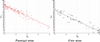 |
Figure 4 Relation of NCIS in different areas. |
The relation of NCI and SM in passenger and crew area are expressed in equations (2) and (3), respectively.
 (2)
(2)
 (3)
(3)
The expression shows that each level of satisfaction represents for a comfort scale of about 16.
3.3.2 The results of SE
The final result of the questionnaire is shown in Tables 4 and 5.
Average and mode of the results in passenger area and expected satisfaction.
Average and mode of the results in crew area and expected satisfaction.
3.4 Application of the method
Based on the results of subjective experiment, the relation of the acoustic comfort and the satisfaction can be described as LN. And for space classification, the comfort limits and classification are described in LS and CS as the final results.
3.4.1 The NCI model
This part is for the application. In order to make the subjective experiment of NCI can be replaced by this model, a prediction model. Put the acoustic parameters of the sound samples into the model, and the NCI can be obtained.
The NCI can be predicted/evaluated through the psychoacoustic parameters as the calculated NCI. An empirical comfort model is formulated to predict the NCI based on acoustic parameters including LA, loudness, sharpness, roughness and fluctuation. This model is established by multiple linear regression [13, 14] to show the contribution of each parameter [12] in expression 4.
 (4)
(4)
where, x1, x2, x3, x4 and x5 are LA, loudness, sharpness, roughness and fluctuation. The loudness, sharpness, roughness and fluctuation are calculated with the Audio Toolbox in Matlab2022b. The loudness in sones is computed according to the auditory model defined in ISO standard 532-1 (Zwicker). The sharpness in acum is computed according the DIN 45692 and ISO 532-1 standards. The R2 of the model is 0.929, F value is 512.246 and P value is 0.00. That means it is reliable of this model to predict the comfort.
3.4.2 The LN
Based on equations (3) and (4), the LN of both areas can be calculated and is shown in Tables 6 and 7. The limits in passenger area are higher than that in crew area.
The comfort scale and limits in passenger area.
The comfort scale and limits in crew area.
3.4.3 The L S and C S
Based on the definitions in Section 2.1 and SE, the LS and CS are obtained. The LS and CS in passenger and crew areas are shown in Tables 8 and 9. The CS is based on the results of SE and corresponding limits of NCI. The CS is a 3-level classification for each space with the level of SE as the middle level i.e., level 2. As for which level it has to reach or it is qualified, this is beyond this study because there are other conditions to be considered. In crew areas, as we can see from the Table 9, some spaces like machinery spaces are only have two level of classification because level 1 and 2 are the same. The noise from the machine is inevitable, the acoustic comfort here in these spaces is not good. And these places are barely visited by the crew so they barely have effect on people. Therefore, the crew do not have high expectation on these spaces and the classification is more rough than other spaces.
Comfort limits and classification in passenger areas.
Comfort limits and classification in crew areas.
4 Discussion
4.1 The relation to A-weighted level
In order to compare with the previous/old classification, a relation between two descriptors is built. The relation between NCI and LA can be obtained by first-order fitting the dots. Figure 5 illustrates the NCI and LA are directly proportional.
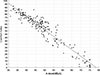 |
Figure 5 Relation of comfort-A-weighted level. |
The relation of NCI and LA is expressed in equation (5)
 (5)
(5)
The expression shows that each level of comfort corresponds a LA scale of about 0.5 dB(A).
In this classification, each level of satisfaction represents for a comfort scale of about 16 and an LA scale of 8 dB(A). Therefore, the scale of each classification described in NCI is about 16. Each classification has corresponding limits of comfort as in LN calculated based on expression 2 and 3. The limits of LA calculated based on expression 5. The results of the limits and scales of each classification are shown in Tables 10 and 11.
Classification and limits of the passenger area.
Classification and limits of crew area.
Take noise classification in passenger areas of the ship as an example to indicate the progress of this modified classification as shown in Table 12. The LA based classification is a highest limit based classification. The scale and limits of each level is not clarify. This satisfaction based NCI classification is an experiment-based classification. The scales and limits are convincing for it is based on the subjective experiment and investigation. It represents for the level of feelings. As we can see from the comparison, the LA limits of the old classification actually have a lower comfort level than LS. This can also indicate that it is not enough for the habitability and perception to use LA based indicator as the only descriptor.
Comparison between old and new classification in passenger areas.
4.2 Extension
From the perspective of academic, it dose need more ships for the research and application. But there is only one ship at present in this paper. This ship is expensive and hard to build as a representative Ro-Pax ship in China. And due to the difficulty of obtaining the sound samples (samples have to be recorded during navigation, so it cost a lot money and time). So this paper only takes this ship as an example to introduce a new classification method. If there is an opportunity, more ships could be added in the future work.
This study has no ambition to take noise and vibration into consideration simultaneously, nor to have noise controlled, but aims to develop a perceptual based acoustic classification of ships. In fact, this method is about classifying the perception and build the relation between the physical parameters and perception. Therefore, this classification can also be applied to vibration since the situation of existing classification and the application scenarios of vibration are almost the same.
The statement of this paper is not only for shipping sector but mainly for it. It can be also applied in other aspects which require a classification of the sound environment.
5 Conclusion
This study developed a satisfaction based comfort classification approach for noise in various compartments of the ship. First, the comfort related indicators are obtained. Then, the NCI is classified based on SM and its limits are also obtained. Next, based on SE, LS can be obtained.
For practical applications, after establishing the NCI model, the calculated NCI can be calculated. And a 3-level CS is determined for each space by comparing LS. Compared with this kinds of classifications before, instead of taking the physical parameter as the only indicator, this work focuses on how people feel about each space on ship and contribute to the well-being of people on ship.
Acknowledgments
The authors want to acknowledge the help received by the China Classification Societies (CCS) in sample acquisition and in particular want to thank Yajun Zhou and Jiangxuan Qin for their kind support and assistance. This work was financially supported by the National Natural Science Foundation of China (Grant No. 12274350). This study was performed in line with the principles of the Declaration of Helsinki. Approval was granted by the Institutional Ethical Review Board, Northwestern Polytechnical University (No. 202202023).
Conflicts of interest
The authors declare that there is no conflict of interest.
Data availability statement
The data are available from the corresponding author on request.
Appendix A Questionnaires of the expected satisfaction and the results (The actual questionnaires are in Chinese)
Expected satisfaction survey of acoustic environment for passengers
In order to contribute to a good acoustic environment on board, we are conducting a research about the evaluation of noise satisfaction of ships. We hope to have your cooperation.
Assuming you are a passenger on a ship, please rate your expectations of the noise environment in passenger rooms and common areas (no need to judge a place you haven’t been to).
Expected satisfaction of acoustic is what this acoustic environment of space should be in your expectation. One stands for “it should be very satisfied”, five stands for “it could be not satisfied at all”. For example, top level cabins should be one and open recreation areas should be five. Mark “√” under the corresponding option.
Expected satisfaction survey of acoustic environment for crew
In order to contribute to a good acoustic environment on board, we are conducting a research about the evaluation of noise satisfaction of ships. We hope to have your cooperation.
Assuming you are a member of the crew on a ship, please rate your expectations of the noise environment in crew rooms and common areas (no need to judge a place you haven’t been to).
Expected satisfaction of acoustic is what this acoustic environment of space should be in your expectation. One stands for “it should be very satisfied”, five stands for “it could be not satisfied at all”. For example, top level cabins should be one and machinery spaces should be five. Mark “√” under the corresponding option.
| 1 | 2 | 3 | 4 | 5 | Hard to judge | |
|---|---|---|---|---|---|---|
| Standard cabins for passengers | ||||||
| Top level cabins for passengers | ||||||
| Disco | ||||||
| Bar | ||||||
| Chinese restaurant | ||||||
| Western restaurant | ||||||
| Cinema | ||||||
| Chess and card room | ||||||
| Gymnasium | ||||||
| Multipurpose room | ||||||
| Theatre | ||||||
| Gallery | ||||||
| Library | ||||||
| Concert hall | ||||||
| Beauty parlor | ||||||
| Supermarket | ||||||
| Lobby | ||||||
| Atrium | ||||||
| Corridors | ||||||
| Staircase | ||||||
| Swimming pool | ||||||
| Open recreation areas | ||||||
| Open gymnasium |
| 1 | 2 | 3 | 4 | 5 | Hard to judge | |
|---|---|---|---|---|---|---|
| Standard cabins for crew | ||||||
| Top level cabins for crew | ||||||
| Canteen for crew | ||||||
| Meeting rooms | ||||||
| Recreation rooms | ||||||
| Gymnasium | ||||||
| Open recreation areas | ||||||
| Navigating bridge | ||||||
| Radar rooms | ||||||
| Offices | ||||||
| Workshops | ||||||
| Control room | ||||||
| Switchboard room | ||||||
| Kitchen | ||||||
| Pantry | ||||||
| Laundry | ||||||
| Machinery spaces | ||||||
| Air-conditioning rooms | ||||||
| Generator room | ||||||
| Steering gear room | ||||||
| Wards | ||||||
| First aid room | ||||||
| Treatment rooms |
References
- J. Back, S.K. Lee, S.M. Lee, K. An, D.H. Kwon, D.C. Park: Design and implementation of comfort-quality HVAC sound inside a vehicle cabin. Applied Acoustics 177 (2021) 107940 [CrossRef] [Google Scholar]
- K. Qian, Z. Hou: Intelligent evaluation of the interior sound quality of electric vehicles. Applied Acoustics 173 (2021) 107684 [CrossRef] [Google Scholar]
- M. Navai, J.A. Veitch: Acoustic satisfaction in open-plan offices: review and recommendations, in: Research Report RR-151. Institute for Research in Construction, National Research Council Canada, Ottawa, Canada, 2003. Available at: http://www.nrc-cnrc.gc.ca/obj/irc/doc/pubs/rr/rr151/rr151.pdf. [Google Scholar]
- D. Borelli, T. Gaggero, E. Rizzuto, C. Schenone: Onboard ship noise: acoustic comfort in cabins. Applied Acoustics 177 (2021) 107912 [CrossRef] [Google Scholar]
- J.A. Bocanegra, D. Borelli, T. Gaggero, E. Rizzuto, C. Schenone: Characterizing onboard noise in ships: insights from statistical, machine learning and advanced noise index analyses. Ocean Engineering 285 (2023) 115273 [CrossRef] [Google Scholar]
- S. Kanka, L. Fredianelli, F. Artuso, F. Fidecaro, G. Licitra: Evaluation of acoustic comfort and sound energy transmission in a yacht. Energies 16, 2 (2023) 808 [CrossRef] [Google Scholar]
- M. Rocca, F.D. Puccio, P. Forte, F. Leccese: Acoustic comfort requirements and classifications: buildings vs. yachts. Ocean Engineering 255 (2022) 111374 [CrossRef] [Google Scholar]
- J. Blauert, U. Jekosch: Sound-quality evaluation – a multi-layered problem. Acta Acustica United with Acustica 83, 5 (1997) 747–753 [Google Scholar]
- E. Zwicker, L. Fastl: Psychoacoustics-Facts and Models. Springer-Verlag, Berlin-Heidelberg-New York, 1990 [Google Scholar]
- S. Fidell: The Schultz curve 25 years later: a research perspective. Journal of the Acoustical Society of America 114, 6 (2003) 3007–3015 [Google Scholar]
- P. Dunbavin, C. Clark: ISO/TS 15666:2021 – Acoustics – Assessment of noise annoyance by means of social and socio-acoustic surveys. Acoustics Bulletin 4 (2021) 47 [Google Scholar]
- E. Zwicker, L. Fastl: Psychoacoustics-Facts and Models. Springer-Verlag, Berlin-Heidelberg-New York, 1990 [Google Scholar]
- F. Li, Y.Y. Zuo: Sound quality evaluation control of car interior noise. Applied Mechanics & Materials 415 (2013) 569–573 [CrossRef] [Google Scholar]
- D. Li, Y. Huang: The discomfort model of the micro commercial vehicles interior noise based on the sound quality analyses. Applied Acoustics 132 (2018) 223–231 [CrossRef] [Google Scholar]
Cite this article as: Zhao H. Chen K. Li H. Luo J. & Dang J. 2025. Method of satisfaction based on-board acoustic comfort classification and its applications. Acta Acustica, 9, 22. https://doi.org/10.1051/aacus/2025006.
All Tables
All Figures
|
Figure 1 Approach and application of this classification. |
| In the text | |
|
Figure 2 Procedure of the experiment. |
| In the text | |
|
Figure 3 Picture of the subjective experiment. |
| In the text | |
|
Figure 4 Relation of NCIS in different areas. |
| In the text | |
|
Figure 5 Relation of comfort-A-weighted level. |
| In the text | |
Current usage metrics show cumulative count of Article Views (full-text article views including HTML views, PDF and ePub downloads, according to the available data) and Abstracts Views on Vision4Press platform.
Data correspond to usage on the plateform after 2015. The current usage metrics is available 48-96 hours after online publication and is updated daily on week days.
Initial download of the metrics may take a while.