| Issue |
Acta Acust.
Volume 9, 2025
|
|
|---|---|---|
| Article Number | 21 | |
| Number of page(s) | 15 | |
| Section | Virtual Acoustics | |
| DOI | https://doi.org/10.1051/aacus/2025005 | |
| Published online | 11 March 2025 | |
Scientific Article
Effect of HRTFs and head motion on auditory-visual localization in real and virtual studio environments
Institute of Electronic Music and Acoustics, University of Music and Performing Arts Graz, 8010 Graz, Austria
* Corresponding author: This email address is being protected from spambots. You need JavaScript enabled to view it.
Received:
2
July
2024
Accepted:
27
January
2025
Abstract
When localizing sound sources in natural or virtual environments, multisensory integration that combines auditory and visual cues is often involved. This study aims to determine the effect of (non-)individual head-related transfer functions (HRTFs) on sound source localization in the presence of visual cues. Participants (N = 16) were seated in a hemispherical loudspeaker arrangement, and their task was to indicate the perceived direction of pink-noise bursts. The conditions included localization of real loudspeakers and virtualized loudspeakers based on binaural rendering with (non-)individual HRTFs. The horizontal spacing of the visible loudspeakers was 30 degrees or larger and the vertical spacing was varied between 30 degrees and 15 degrees, to focus on vertical discrimination. The results of a static localization experiment (no head movements during playback) demonstrated an increased rate of vertical local confusions using non-individual binaural room impulse responses (BRIRs) of the KU100 dummy head compared to individual BRIRs. Dynamic auditory-visual localization with non-individual HRTFs suffered from vertical uncertainty and bias in the frontal area, where local confusion rates were consistent with the static experiment. In conclusion, the horizontal localization mapping of dynamic binaural rendering with non-individual HRTFs was comparable to real loudspeaker reproduction, while the vertical mapping was significantly impaired.
Key words: Auditory-visual localization / Binaural rendering / Virtual and augmented reality / Head-related transfer functions
© The Author(s), Published by EDP Sciences, 2025
 This is an Open Access article distributed under the terms of the Creative Commons Attribution License (https://creativecommons.org/licenses/by/4.0), which permits unrestricted use, distribution, and reproduction in any medium, provided the original work is properly cited.
1 Introduction
Sound localization enables humans to identify the direction and distance of sound sources in their environment, which is important for spatial awareness and communication. Fundamental research studies on localization accuracy were mostly conducted under strictly controlled anechoic laboratory conditions [1–6], excluding the effects of sound reflections and room reverberation. As environments of
higher ecological validity in the contexts of 3D audio, virtual reality (VR), and augmented reality (AR), reference studios for spatial audio reproduction could be considered. They exhibit a
well-defined (non-zero) reverberation time that suits critical listening [7]. Furthermore, listeners are
typically neither blindfolded nor strictly fixed in their position and orientation, and loudspeakers represent visible sound sources.
The present study compares the auditory-visual localization mapping in an (auditory-)virtualized vs. real loudspeaker studio. Binaural rendering for headphones [8, 9] is employed to recreate or virtualize the acoustics of the multichannel loudspeaker environment. Ideally, the localization mapping observed in the real loudspeaker studio can be preserved in the virtualized studio. The subsequent paragraphs outline the scientific background and definitions used in this paper.
Auditory localization refers to “the ability to identify the position and changes in position of sound sources based on acoustic information” [10]. While static localization refers to listening without head movements, dynamic localization includes the freedom to make exploratory head movements [11]. It is well known that the auditory system relies on interaural time and level differences (ITDs and ILDs) as cues to locate sound sources in the horizontal dimension, while monaural spectral cues are associated with localization in the vertical dimension [11, 12]. In general, these auditory cues are listener-specific due to the individual morphology of pinnae, head, and torso [11]. The acoustic transfer paths from a point in the free field to both ear canals contain the auditory localization cues and are referred to as head-related transfer functions (HRTFs) in the frequency domain and as head-related impulse responses (HRIRs) in the time domain.
Studies on static localization of virtual sound sources found increased localization errors in the vertical dimension for non-individual HRTFs compared to individual HRTFs [3, 13]. In an experiment on dynamic localization of real and virtual sound sources, individual HRTFs significantly reduced localization errors in both the vertical and horizontal dimension compared to non-individual HRTFs, and real sound sources yielded a further decrease of the localization error [14]. Since the aforementioned studies were conducted under anechoic conditions, the benefit of individual HRTFs and dynamic localization in moderately reverberant environments remains unclear.
Experiments on auditory localization typically avoid visual cues on source positions, to isolate the effects of acoustic cues. However, studies have demonstrated that providing a 3D visual environment for self-orientation improves the precision of localization responses compared to blindfolded localization [5, 15]. Recent studies on auditory localization in the presence of visual cues (e.g. visible loudspeakers) –hereafter referred to as auditory-visual localization– suggest that both auditory and visual cues are integrated to identify the position of sound sources [16–18].
Multisensory integration can lead to a perceptual fusion of the auditory event and a visual anchor, and auditory-visual localization is typically biased towards the visual cue, known as the ventriloquism effect [19, 20]. However, if auditory and visual cues are incongruent, multisensory fusion is inhibited and the auditory event is perceived separately from visual cues, e.g. amplitude panning can render auditory events perceived between visible loudspeakers [21–23]. Similarly, virtual sound sources rendered over headphones can potentially result in auditory events perceived between visible source locations, e.g. due to non-individual HRTFs or a mismatch between audio and video rendering, cf. [24].
This study concerns auditory-visual localization of sound sources in a real and virtualized studio environment. The aim is to investigate the effect of (non-)individual HRTFs on sound source localization in the presence of visual cues. In particular, localization of “real” sound sources is investigated alongside “virtual” sound sources rendered over headphones. This aims to extend literature that has mostly focused on real sound sources and the effect of head-worn devices when investigating auditory-visual localization [16, 17, 25]. The study addresses the following research questions (RQ):
-
RQ1: Do non-individual HRTFs of a dummy head impair static auditory-visual localization in a studio room environment?
-
RQ2: Does dynamic listening (free head movements) improve auditory-visual localization with non-individual HRTFs?
-
RQ3: How does the vertical spacing of visible loudspeakers affect auditory-visual localization with individual/non-individual HRTFs?
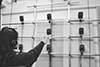 |
Figure 1 Participant wearing circumaural open headphones during the experiment task in a studio room (RT30 = 0.2 s). Motion-tracking is enabled via an OptiTrack system (NaturalPoint Inc.) with markers attached to the headphones and the toy gun. |
2 Methods
Participants were seated in a multichannel loudspeaker studio, which provides a realistic visual environment including visual cues of potential sound sources, cf. Figure 1. Their experimental task was to indicate the perceived direction of pink-noise bursts by pointing a toy gun.
2.1 Static vs. dynamic localization
The first experiment in this study investigated a static localization scenario in which participants had to maintain a frontal head orientation during stimulus playback. The position and orientation of the participants was monitored using an OptiTrack motion-capture system (NaturalPoint Inc.) with motion-tracking markers mounted either on a beanie cap or open headphones, cf. Figure 1. During the static experiment, stimulus playback was automatically muted for position shifts of more than 5 cm along the front-back or left-right axes, and for head rotations by more than 2 degrees in azimuth or 5 degrees in pitch/roll.
The second experiment in this study investigated a dynamic localization scenario, in which participants were allowed to freely move their head during stimulus playback, while they would remain seated on a swivel chair in the center of the loudspeaker setup.
2.2 Real vs. virtual conditions
The sound reproduction is either real or virtual and involves listening to: (i) real loudspeakers with uncovered open ears as a reference condition, (ii) real loudspeakers with the slight covering of open headphones, and virtualized loudspeakers rendered using (iii) individual or (iv) non-individual HRTFs and measured room responses. For conditions (ii), (iii), and (iv), open headphones of type “MushRoom” [26] were used that were designed to maximize acoustical transparency to allow for a successive presentation of the real and virtual stimuli [25]. This provides an ecologically valid setting for AR applications, in which virtual sources should seamlessly blend with real sources [27, 28].
2.3 Pointing method and task
Auditory-visual localization responses were collected by means of a toy gun equipped with motion-tracking markers. Response angles were obtained from the position and orientation of the gun when confirming the response, by calculating the intersecting point of a line from the gun and the convex hull of the loudspeaker arrangement. This method technically allows for a pointing precision within one degree [29], and it was demonstrated experimentally to capture localization errors as low as one degree, cf. [30], Tab. 1]. As an egocentric pointing method, it provides lower pointing errors than exocentric methods (e.g. response on a 2D schematic map) [6, 31]. Prior to the experiment, each participant was introduced to the pointing method and asked to aim towards the frontal loudspeaker at zero degrees elevation and azimuth using the toy gun’s iron sights. Participants were verbally informed how accurate their aiming aligned with the frontal direction, and after the pointing precision was better than 2 degrees in azimuth and elevation, they could start with the experiment.
For the experimental tasks, participants were instructed to aim the toy gun at the direction of the perceived auditory event, regardless of whether it aligns and fuses with a visible loudspeaker or not. In the two experiments, the stimuli were pink-noise bursts reproduced over individual loudspeakers of the arrangement, cf. Section 2.5, and no amplitude-panned sound events between loudspeaker locations were tested (participants were not aware of this). Although localization responses were expected to cluster at the visual anchors [17, 19], various conditions also caused auditory events that could not be clearly associated with visual anchors (e.g. in static binaural rendering). The instruction to respond freely allowed to capture this behaviour in the collected data, see Section 3.
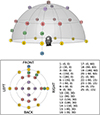 |
Figure 2 Schematic representation of loudspeaker directions in the experiment: 3-D view (top) and 2-D projection (bottom) showing loudspeakers as circles with their coordinates listed (azimuth and elevation in degrees). |
2.4 Room and loudspeaker setup
The experiments presented in this paper were conducted in an acoustically dry studio room, equipped with a 25-channel loudspeaker arrangement (room dimensions of 6.2 m × 4.3 m × 3.4 m = 90.6 m3; loudspeaker distances to center of 2 m ± 0.1 m). The average reverberation time in the octave-bands from 250 Hz to 8 kHz was RT30 = 0.204 s, measured in the center position of the array using an omnidirectional Earthworks M55 measurement microphone. The loudspeakers employed were Genelec 8020 full-range loudspeakers, specified by the manufacturer to have a ±2.5 dB flat frequency response from 60 Hz to 20 kHz.
The loudspeaker arrangement shown in Figure 2 is based on the studio recommendation in ITU-R BS.2051-3 [32], which typically requires a 30-degree spacing in azimuth for the frontal area and a 30-degree spacing in elevation between the loudspeaker layers of a multichannel setup (cf. Tab. 12 of the recommendation). Loudspeakers at 60 degrees elevation were included, as recent findings suggest that this elevation layer is important to elicit a sensation of being covered by sound [33]. Additionally, the vertical loudspeaker density varied between 30 degrees in the left hemisphere and 15 degrees in the right hemisphere. The 15-degree vertical spacing serves as a control condition as it is expected to produce vertical local confusions among the visible loudspeakers in both real and virtual conditions [2].
Loudspeaker responses of all Genelec 8020 in the room were measured in the center of the array using the omnidirectional Earthworks M55 measurement microphone. These room impulse responses were truncated to RT30 employing a cosine-squared fade-out window of 1024 samples (21 ms at 48 kHz sampling rate). Minimum-phase finite impulse response (FIR) filters were derived from the third-octave smoothed responses, in order to equalize spectral and overall level differences in the loudspeaker setup. These filters were applied to all real loudspeaker conditions, and to the static virtual conditions of the first experiment, which were rendered from binaural room impulse response (BRIR) measurements. The audio playback of all experimental stimuli was facilitated by the REAPER digital audio workstation (DAW) and an RME Madiface Pro connected to RME M-32 DA digital-to-analog converters operating at a sampling rate of f s = 48 kHz.
2.5 Stimuli
In the static experiment, the stimulus signal was a pink-noise burst of 250 ms duration with a sine-squared fade-in of 1 ms and a cosine-squared fade-out of 1 ms, cf. Middlebrooks et al. [34]. A new noise burst was rendered for each condition and for each participant of the experiment to avoid bias or accommodation effects due to a particular noise burst spectrum. The pink-noise bursts were high-pass filtered using a fourth-order Butterworth high-pass with a cut-off frequency of 200 Hz to achieve timbral similarity between loudspeaker and headphone stimuli.
The stimulus signal in the dynamic experiment was a sequence of six uncorrelated pink-noise bursts with a total length of three seconds, to allow for head movements during stimulus playback. Each noise burst had a length of 250 ms and was followed by 250 ms of silence. Sine-squared fades and high-pass filtering were applied to the noise bursts as in the static experiment. In both experiments the stimulus could be triggered repeatedly by the participants.
2.6 Static binaural rendering
The virtual stimuli of the static experiment included an individual and a non-individual binaural condition. To this end, individual BRIR measurements were conducted before the actual experiment. Additionally, individual headphone transfer functions were measured directly after the BRIR measurement, to enable equalization of the exact positioning of the binaural microphones within the ear canal. Minimum-phase (binaural) equalization filters were derived by inverting the third-octave smoothed headphone transfer functions between 200 Hz and 20 kHz. At the band limits, the normalized filter magnitude responses were faded out by cosine-squared windows (one octave bandwidth at the low end and third-octave bandwidth at the high end).
The individual binaural measurements employed the DPA 4560 CORE binaural headset microphone. The capsules do not fully block the ear canal even for a tight fit at the ear canal entrance, and could therefore be considered “semi-open” ear canal measurements. Literature on binaural technology typically recommends measurements to be taken at the entrance of the blocked ear canal, to reduce measurement variance induced by the (variable) positioning of microphones within the open ear canal [35]. However, a more recent study could not find any difference in the perceptual quality (plausibility and authenticity) between open and closed ear canal measurements [36], hence this study employed the DPA binaural microphone due to the flat frequency response and the good localization ability during pilot tests of individually-rendered virtual sources.
As a non-individual binaural condition, BRIR measurements of the Neumann KU100 dummy head were taken at the listening position of the experiment. The KU100 is a diffuse-field equalized dummy head and known for its high timbral and spatial quality [37, 38]. Headphone transfer functions were measured on the KU100 dummy head to derive non-individual equalization filters. These minimum-phase FIR filters were derived in the same way as for the individual measurements, by inverting the third-octave smoothed responses from 200 Hz to 20 kHz.
All measured BRIRs were faded out at 7000 samples (140 ms) after the direct sound by applying a cosine-squared window of 1024 samples (21 ms). Although the reverberation time was estimated to be 204 ms, a 60 dB level offset from the BRIR peak was given already at 140 ms, and windowing at this time index ensured a smooth fade-out towards the noise floor.
2.7 Dynamic binaural rendering
In the dynamic experiment, the participants were allowed to move their head and body in the center of the loudspeaker arrangement during stimulus playback. Since free movement in the center of the loudspeaker arrangement naturally permits small translatory movements of the head and upper body, it was a requirement to render at least the direct sound in six degrees of freedom (6-DoF). Hybrid binaural rendering was employed [9], where the direct sound was rendered by convolution with diffuse-field equalized head-related impulse responses (HRIRs), while the room acoustics were rendered in higher-order Ambisonics.
Two virtual conditions were created, which differed in terms of the HRIR database used for the direct sound rendering. The two HRIR databases employed were the Neumann KU100 (head only) and the GRAS KEMAR (head and torso simulator), which are publicly available in a 2-degree angular resolution in azimuth and elevation [39, 40]. This resolution assures a high-quality binaural rendering based on a convolution with the nearest available HRIR [41], eliminating the need for real-time interpolation [14, 42]. Diffuse-field equalization was applied to the KEMAR HRIR set, to be consistent with the (diffuse-field equalized) KU100 dataset. Headphone equalization filters were employed as in the static experiment, based on measurements of the KU100 dummy head. An individualized binaural rendering condition was not considered in the dynamic experiment, since high-resolution HRIRs of the test subjects were not available.
The direct sound was rendered by an (overlap-add) block-based convolution with the nearest available HRTF in the dataset. A custom (open-source) VST plug-in was developed for this purpose [43]. Audio rendering was done in the REAPER DAW with a blocksize of 512 samples (10.66 ms at f s = 48 kHz). The OptiTrack system adds a latency below 10 ms, which ensured an overall motion-to-sound latency well below the detection threshold of 45 ms [44].
The 6-DoF direct sound rendering included 1/r distance gains and the loudspeaker directivity. Third-order directivity measurements of the Genelec 8020 [45] were on-axis equalized and reconstructed as minimum-phase FIR filters with a length of 2048 samples. Each loudspeaker signal is convolved with the filters to generate third-order directivity signals as input to the direct sound rendering plug-in, which uses an Ambisonic decoding stage to obtain the (directivity-filtered) signal for HRTF convolution. To ensure a comparable equalization scheme to the real loudspeaker stimuli, only broadband gain factors were used to compensate for the directional leveldifferences in the center of the array. A delay-based simulation of the loudspeaker time of flight was not considered necessary for this study, as each condition exclusively activates one of the loudspeakers at a time.
Acoustical properties of the experiment room were captured in measurements of directional room responses. For each channel in the loudspeaker setup, a first-order Ambisonic room impulse response was measured in the center of the loudspeaker arrangement using a (tetrahedral) Soundfield ST450 microphone. Its WXYZ output channels were processed by the Ambisonic spatial decomposition method (ASDM) to increase the spatial resolution of the first-order room impulse responses to fifth-order Ambisonics [8]. After removing the time of flight in the impulse responses, all direct sound components were replaced by zeros followed by a 16-sample sine-squared fade-in before the first early reflection in the room impulse responses. The resulting impulse responses were convolved in real-time using the mcfx-convolver VST plug-in. The output was rotated interactively using the IEM SceneRotator plug-in, and decoded using the IEM BinauralDecoder (KU100 HRTFs), which implements the magnitude-least-squares (MagLS) approach [23, 46]. This 3-DoF auralization of the room acoustics seemed sufficient as participants were required to remain in the center of the loudspeaker arrangement during the localization experiment. While small translations of the head were accounted for in the direct sound rendering, they were neglected in the room acousticauralization [47].
To ensure a plausible direct-to-reverberant energy ratio for the virtual conditions, the RMS level of the HRIR direct-sound renderer was adjusted to match the RMS level that would be measured from the (binaurally-decoded) direct-sound component of the upmixed room impulse responses.
2.8 Data collection and experiment protocol
The experiment protocol was implemented in a custom standalone software application developed with the JUCE/C++ framework. Participants had the toy gun in one hand and a small USB controller in the other hand. The USB controller was used to trigger the stimulus playback in the self-paced listening experiments and to log localization responses, as the toy gun itself did not have an electronic trigger and served merely as a lightweight aiming device. The software application received the tracking data of the toy gun from the OptiTrack Motive software upon a button trigger on the handheld USB controller. To move to a new trial, participants had to return to a frontal orientation in order to confirm their response on a small keypad positioned next to them.
The static experiment was composed of two parts. In the first part, the 25 loudspeaker directions were localized in a randomized order with uncovered ears, wearing only a beanie cap for position/orientation monitoring. The second part entailed 150 trials wearing the open headphones, where real and virtual loudspeaker sources were interleaved in a fully randomized order (25 × 2 × 3 = 150 trials; the 25 loudspeaker directions were rated twice for the individual BRIR, the KU100 BRIR, and the real loudspeaker condition). The static experiment was preceded by a training phase in dynamic conditions, where participants localized all 25 loudspeaker directions (i.e. all visual anchors) in a randomized order to familiarize them with the pointing task.
The dynamic experiment consisted of 25 similar loudspeaker trials with uncovered ears (randomized order) that were similarly followed by 150 trials wearing the open headphones, where, again, both real and virtual conditions were interleaved in a fully randomized order (25 × 2 × 3 = 150 trials; the 25 directions were rated twice, for the KEMAR HRIR, the KU100 HRIR, and the real loudspeaker condition).
2.9 Calculation of error metrics
Poirier-Quinot et al. [48] presented a systematic review and advanced methodology for HRTF evaluation studies, from which some of the terminology is adopted here. Localization bias (accuracy) and precision are typically calculated as the mean and standard deviation of the localization error, which quantifies the difference of the target direction from the response direction [5]. Due to the non-uniform grid of visual anchors in the auditory-visual localization task, the typical angular errors could be a misleading metric. Therefore alternative measures to quantify localization bias and precision were employed (angular error analysis is appended as supplementary material, see Sect. Data availability statement).
As a first step, each response that deviates from the target direction by more than 90 degrees great-circle distance was counted as a “quadrant error” (QE) [34, 49] and disregarded in the subsequent analysis. The quadrant error rate in percent (QER) is reported as a metric, and the remaining responses are considered “local responses”. As an overall assessment of the localization mapping in horizontal and vertical planes, a regression line described by its slope g is used (elevation/azimuth gain), and ideally g = 1 with an intercept equal to zero [48, 50]. As a measure of precision, a local confusion rate (LCR) is calculated. A response is considered a local confusion if it lies closer to another loudspeaker than the actual target loudspeaker. The metric is calculated in horizontal planes and vertical planes separately (based on azimuth and elevation response components). The ratio between the number of local confusions and the number of local responses for a target is defined as the LCR in percent. Note that the number of local responses can vary among conditions, depending on the QER.
2.10 Subjects
Sixteen participants took part in the static auditory-visual localization experiment (14 male and 2 female with a mean age ± standard deviation of 34.4 ± 9.9 years). Seven of the sixteen participants were institutional staff members and can be considered expert listeners based on participation in multiple spatial audio experiments. Participants took 50 min on average to complete the static localization task.
In a separate session three months after the first experiment, sixteen participants took part in the dynamic localization experiment (13 male and 3 female with a mean age ± standard deviation of 37.8 ± 12.4 years). Eight of these participants had taken part in the static experiment, of which seven were the expert listeners. Participants took 31 min on average to complete the dynamic localization experiment.
All participants reported normal hearing abilities. Informed consent was obtained from all participants of the two experiments, to adhere to the protocol approved by the ethics advisory council of the University of Music and Performing Arts Graz.
2.11 Statistical analyses
Wilcoxon signed-rank tests are used to test paired data of the static and dynamic experiment, whereas Mann-Whitney U tests are used to compare data between the static and dynamic experiment (3 months apart, not all subjects in both experiments). Two-sided alternative hypotheses are tested using scipy.stats.wilcoxon and scipy.stats.mannwhitneyu in Python. The significance level is α = 0.05, and a Bonferroni-Holm correction is applied to account for multiple comparisons. As a non-parametric measure of effect size, Cliff’s delta (δ) is reported alongside the p-values (0 ≤ |δ|≤1) [51]. The typical interpretation in literature suggests that values of 0.15, 0.33, and 0.47 indicate the lower limits for a small, medium, and large effect, respectively [52].
3 Results
The auditory-visual localization experiments described in the methods section of this paper allow to address the research questions RQ1 to RQ3. A direction-dependent analysis of localization responses is presented in the following subsections focusing on: quadrant errors, horizontal localization, and vertical localization. Overall results and statistical tests regarding the research questions can be found in Section 3.4.
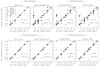 |
Figure 3 Azimuth component of localization responses in the static vs. dynamic listening experiment for loudspeakers at 0, 30, and 60 degrees elevation (N = 16). Responses to the different target elevations are displayed in different colors (gold: 0 degree, red: 30 degree, purple: 60 degree) and are horizontally spaced around a corresponding target azimuth. The average local confusion rate ( |

3.1 Quadrant errors
The QER as defined in Section 2.9 is reported in Table 1 for static localization. For the frontal loudspeaker (zero azimuth and zero elevation), the open-ear reference condition shows a QER of 0% and the open headphone condition (passive covering) shows a QER of 3%. In comparison, the individual BRIR condition shows a QER of 9%, while the non-individual KU100 BRIR shows a QER of 38%. For the rear loudspeaker (180 degrees azimuth and zero elevation), the lowest QER is also found for the reference condition (6%), followed by the individual BRIR (9%), the open headphones (12%), and the KU100 BRIR (16%). Note that for the frontal and rear loudspeaker, quadrant errors correspond to confusions in the front-back dimension (front/back hemisphere). The average QER evaluated over all directions in the experiment is below 10% for all reproduction methods. In dynamic localization, the QER is zero for all reproduction methods, as expected, and therefore not displayed in the table.
Quadrant error rates (QER) for static localization. The frontal direction (loudspeaker 1), the rear direction (loudspeaker 5), and the average across all 25 directions is evaluated. In dynamic localization, the QERs were 0% for all reproduction methods.
3.2 Horizontal localization
To gain a detailed insight into the horizontal localization behavior, the azimuth component of the local responses is plotted in target-response graphs, cf. Figure 3. Per plot, the median slope g of the linear regression is reported together with the average local confusion rate ( ), cf. Section 2.9. Quadrant errors were removed prior to the analysis, which removes localization errors in the front-back dimension at 0 degree elevation, while a number of such errors remain for the30- and 60-degree elevation targets. For example, in static localization, front-to-back and back-to-front confusions appear for elevated targets at 0 and 180 degree azimuth, see Figure 3 (top row, columns 2–4).
In static localization, azimuth errors in terms of local confusions occur mostly for targets at 30 and 60 degrees elevation. The average LCR evaluated over the hemispherical set is  for all reproduction methods. While the azimuth gain is nearly ideal for the static open-ear reference (g = 0.95), it is reduced by wearing the open headphones (g = 0.82) and in the virtual conditions (g = 0.83 for individual BRIR vs. g = 0.72 for KU100 BRIR). In dynamic localization, local confusions in azimuth are practically absent and g ≥ 0.88 for all reproduction methods, as expected in the laterally-sparse studio arrangement with azimuth spacings of 30 degrees or larger. Statistical tests to compare the horizontal LCR for different experimental conditions are presented with the overall results in Section 3.4. Diagrams displaying a separate analysis for the different elevation layers can be found in the supplementary material, cf. Section Data availability statement.
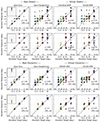 |
Figure 4 Elevation component of localization responses in the static vs. dynamic listening experiment for sources in the median vertical plane. Diamonds indicate median across subjects (N = 16). In the frontal vertical plane, non-individual binaural conditions suffer from an upward bias in static and dynamic rendering. The local confusion rate (LCR) is reported per target loudspeaker together with the average local confusion rate ( |

3.3 Vertical localization
The following paragraphs are dedicated to a detailed inspection of the vertical localization behavior observed in the static and dynamic auditory-visual localization experiments, focusing on source directions in the median plane (0 and 180 degree azimuth) and the frontal plane (±90-degree azimuth). An overall evaluation including data from all vertical planes is presented in Section 3.4.
3.3.1 Vertical localization for 0 and 180 degree azimuth
Figure 4 (top) shows elevation responses for static localization in the median plane (0 and 180 degree azimuth). Most notably, the individual BRIR condition yields an elevation gain of g = 0.84 in the frontal median plane, despite of an increase in the LCR observed compared to the open-ear reference ( vs.
vs.  ). The vertical mapping when wearing open headphones is comparable to the individual BRIR condition, despite higher LCRs for the loudspeakers at −15 and 0 degrees elevation in the frontal median plane. The non-individual KU100 BRIR shows severe elevation mapping errors and upward bias, e.g. for the frontal loudspeakers at −15, 0, and 15 degrees, cf. Figure 4 (row 1 column 4). For sources in the rear median plane (row 2), the LCRs are generally high for the two elevated sources, despite the 30-degree spacing.
The results for dynamic localization of sources in the median plane are shown in Figure 4 (bottom). The elevation bias for frontal sources is present also for the dynamic binaural rendering with KU100 HRTFs (g = 0.66 and  ). The KEMAR HRTF does not yield clear improvements (g = 0.68 and
  ). The open-headphone condition yields a reduced average LCR for the loudspeakers in the frontal median plane, but vertical localization remains clearly impaired compared to the open-ear reference (
 vs.
vs.  ). The vertical localization of sources in the rear clearly improved in the dynamic experiment, cf. Figure 4 (row 4). However, for the 0-degree elevated loudspeakers in the rear, upward confusions remain in dynamic binaural rendering with both the KEMAR and KU100 HRTFs, cf. bimodal response distributions in Figure 4 (row 4, columns 3 and 4).
3.3.2 Vertical localization for ±90 degree azimuth
The vertical response data for sources at ±90 degree azimuth is shown in Figure 5. While static localization is nearly ideal with open ears, the open headphones introduce a substantial amount of vertical local confusions, cf. Figure 5 (column 2). For the 30-degree vertical spacing (row 1), auditory-visual localization with individual and non-individual BRIRs is comparable (g = 0.69 with  vs. g = 0.7 with
  ). The individual BRIR condition retains an accurate elevationmapping for the 15-degree vertical spacing, whereas the non-individual BRIR shows a downward bias for all elevated sources, cf. Figure 5 (row 2 column 4).
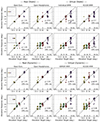 |
Figure 5 Elevation component of localization responses in the static (top) vs. dynamic (bottom) listening experiment for sources in ±90 degree azimuth vertical planes. The sources are vertically-spaced by 30 degrees in the left hemisphere (rows 1 and 3) and by 15 degrees in the right hemisphere (rows 2 and 4). Diamonds indicate median across subjects (N = 16). The local confusion rate (LCR) is reported per target loudspeaker alongside with the average local confusion rate ( |

In dynamic localization, the KU100 HRTF condition shows reduced LCRs for elevated sources located at an azimuth of ±90 degrees, cf. Figure 5 (bottom). However, an increased upward bias for the sources at 0 degree elevation is observed in comparison to the static KU100 condition. The KEMAR HRTF condition suffers from similar impairments, which are not found in the open-headphone condition or for the open-ear reference.
Target-response plots for the other vertical planes at ±30 and ±150 degrees azimuth can be found in the online supplementary material, cf. Section Data availability statement.
3.4 Overall results and statistical tests
Figure 6 shows overall results regarding the horizontal and vertical local confusion rate (LCR). In the horizontal dimension, evaluation combines all data across the 0, 30, and 60 degree height layers of the loudspeaker arrangement. In the vertical dimension, the evaluation combines the data of all vertical planes in the experiment setup.
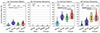 |
Figure 6 Local confusion rate (LCR) in the horizontal (a,b) and vertical (c,d) dimension of the static (a,c) and dynamic (b,d) auditory-visual localization experiment (N = 16). Violin plots show distributions, and boxplots show medians, interquartile ranges, and adjacent values. Horizontal lines indicate statistically significant differences (p < 0.05, Bonferroni-Holm corrected). Asterisks (*) indicate statistically significant differences (p < 0.05, Bonferroni-Holm corrected) between dynamic and static conditions for open ears, open headphones, and KU100 rendering. Static conditions: Open ears (Op. Ear), open headphones (Op. Hp.), individual BRIR (Indiv.), and KU100 BRIR. Dynamic conditions: Open ears (Op. Ear), open headphones (Op. Hp.), KEMAR HRIR, and KU100 HRIR. |
3.4.1 Static localization (RQ1)
In the horizontal dimension, the difference in the LCR between the KU100 BRIR condition and the individual BRIR condition is not statistically significant although a medium effect size is observed (RQ1:  vs.
vs.  , p = 0.151, |δ|=0.36), cf. Figure 6a. The open-ear condition demonstrates the lowest horizontal LCR, and the difference is significant to the open-headphone condition and to the KU100 BRIR condition (p < 0.01, |δ|> 0.75). The difference between the open-ear condition and the individual BRIR condition is not significant despite a medium effect size (p = 0.151, |δ|=0.41). The open-headphone condition shows a significantly higher LCR in the horizontal dimension compared to the individual BRIR condition (p = 0.007, |δ|=0.49).
In the vertical dimension, there is a significant difference between the KU100 BRIR condition and the individual BRIR condition (RQ1:  vs.
vs.  , p = 0.008, |δ|=0.56), cf. Figure 6c. The open-headphone condition shows a significantly lower vertical LCR than the KU100 BRIR condition (p = 0.036, |δ|=0.35), while its difference to the individual BRIR condition is not significant (p = 0.231, |δ|=0.19). The open-ear condition demonstrates the lowest vertical LCR by far, and the difference is significant to all other static conditions (p < 0.001, |δ|> 0.9).
3.4.2 Dynamic localization (RQ2)
In the horizontal dimension, the LCR is negligible for all conditions of the dynamic localization experiment, and no statistically significant differences are found among the conditions, cf. Figure 6b. The reduction in the horizontal LCR compared to static localization is statistically significant for the open-ear, open-headphone, and KU100 condition (RQ2: p < 0.001 with |δ|> 0.68 in all pairwise comparisons). Note that the dynamic KEMAR condition could not be compared to a corresponding static KEMAR condition (not included in the study design).
In the vertical dimension, dynamic localization significantly reduced the LCR for the open-ear condition ( vs.
vs.  , p = 0.009, |δ|=0.57), the open-headphone condition (
 vs.
vs.  , p < 0.001, |δ|=0.96), and the KU100 HRTF condition (RQ2:
  vs.
vs.  , p = 0.046, |δ|=0.42), cf. Figure 6d. The open-ear reference condition demonstrates a significantly lower vertical LCRs than all other dynamic reproduction conditions (p < 0.05, |δ|> 0.69). Interestingly, the dynamic open-headphone condition scores a significantly lower vertical LCR compared to the dynamic non-individual binaural rendering conditions (p < 0.003 with |δ|=0.85 and p = 0.004 with |δ|=0.88 for comparisons to KEMAR and KU100 conditions). No significant difference is found between the KU100 and KEMAR HRTF conditions (p = 0.362, |δ|=0.07).
3.4.3 Vertical loudspeaker density (RQ3)
The effect of the vertical loudspeaker density is tested based on a comparison between the vertical LCR observed for loudspeakers spaced vertically by 30 degrees vs. 15 degrees (loudspeaker indices 2, 10, 3, 11 vs. 8, 16, 7, 15), cf. Figure 2. The effect of the vertical loudspeaker density is statistically significant in all reproduction conditions (RQ3: p < 0.05, |δ|> 0.38) except the dynamic open-ear reference condition (p = 0.102, |δ|=0.19), cf. Figure 7. The 15-degree vertical spacing of loudspeakers results in high LCRs in static localization for all but the open-ear reference condition with median LCR values of 50%. For the 30-degree vertical spacing, the individual BRIR condition results in lower vertical LCRs than the open-headphone condition and the KU100 BRIR condition, cf. Figure 7a, which is an interesting result considering the typical 30-degree vertical spacing in multichannel studio environments. In the dynamic experiment, the open-headphone condition demonstrates a clear reduction in the vertical LCR for both spacings compared to the static experiment, while the KU100 conditions shows no clear improvements for this subset of loudspeakers in the frontal hemisphere (±30 and ±90 degreesazimuth).
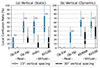 |
Figure 7 Local confusion rate (LCR) in the static (a) and dynamic (b) auditory-visual localization experiments for the 15-degree and 30-degree vertical spacing of sources in the frontal hemifield (N = 16). Boxplots show medians, interquartile ranges, and adjacent values. Horizontal lines indicate statistically significant differences (p < 0.05, Bonferroni-Holm corrected). |
4 Discussion
The experiments in this paper address static and dynamic auditory-visual localization of real loudspeakers and virtualized loudspeakers rendered on open headphones using (non-)individual HRTFs. Participants were seated in a multichannel loudspeaker studio, and their task was to localize pink-noise bursts by pointing a toy gun. In summary, static binaural rendering using non-individual dummy head BRIRs suffered from an increased vertical local confusion rate (LCR) compared to the individual BRIR condition. For dynamic rendering, the particular shortcomings of non-individual dummy head HRTFs regarding vertical uncertainty and bias in the frontal area were persistent, however local confusion errors in the horizontal dimension were absent. Localization of real loudspeakers with open (uncovered) ears resulted in the lowest vertical LCR in the static and dynamic experiment. Localization of real sound sources through open headphones achieved comparable vertical LCRs to the individual BRIR condition in static localization and could benefit from dynamic localization.
Concerning research question RQ1, the first experiment was designed to evaluate static auditory-visual localization without head movements, based on individual and non-individual binaural room impulse responses (BRIR). The individual BRIR rendering clearly improved the vertical localization mapping compared to the non-individual dummy head BRIR condition, see Section 3.4. The benefit of individual cues was particularly clear in the frontal area, which was measured by lower vertical LCRs and lower QERs, cf. Figure 4 (row 1) and Table 1. For sources in the median plane, interaural cues are absent and the highly individual monaural spectral cues are the only available localization cues, which might explain the clear differences. It is particularly interesting that the KU100 dummy head HRTF seems to provide acoustic cues that bias localization upwards for frontal sound sources, which has been validated recently by the authors using an auditory model of sagittal-plane localization [49], cf. [53], Fig. 6a]. Additionally, the auditory model predicted a high QER for the KU100 HRTF in case of a frontal sound source (40 to 50%), cf. Table 1 and [53], Fig. 6b]. In the horizontal dimension, differences between the KU100 BRIR and individual BRIR condition were not statistically significant (despite a medium effect size), which is generally in line with previous research on static auditory localization of virtual sound sources [3]. Overall, the results suggest that listening with non-individual HRTFs can result in impaired auditory-visual localization in the vertical dimension.
To discuss results of real versus virtual loudspeakers, compared to the open-ear reference, the individual binaural rendering demonstrated a greater response variance around the target direction, as measured by higher vertical LCRs, cf. Figures 4–6. The greater variance can be explained by high-frequency inaccuracies of the binaural measurement and reproduction, which may degrade localization of virtual sources when stimuli are not bandlimited (e.g. to 7 kHz), as reported in previous works [4, 34]. Covering the ears by open headphones also distorts the individual HRTF cues and impaired horizontal and vertical auditory-visual localization performance compared to the reference condition, cf. Figures 4, 5 and Section 3.4. This result was expected considering previous work on localization impairments caused by open headphones [25], although the employed “MushRoom” type headphones are highly transparent as confirmed by acoustic measurements, cf. [54], Fig. 2].
Concerning research question RQ2, the second experiment investigated whether dynamic cues during free head movements improve auditory-visual localization. Regarding the non-individual binaural rendering based on KU100 HRTFs, the results demonstrate that exploratory head movements could yield improvements mostly in the horizontal dimension, see Section 3.4. In the vertical dimension, improvements are seen for the sources at 60 degrees elevation, which are likely due to dynamic (non-individual) ITD/ILD cues that support vertical localization, see recent works by Jiang et al. [55], Fig. 3] and Xie et al. [56]. The vertical mapping errors in the frontal area remained, and vertical localization for certain lateral directions seemed impaired in the dynamic case (with an otherwise fairly accurate mapping in static localization). Likely, this behaviour was observed as listeners could face the respective direction in the free dynamic localization task, effectively moving the source into the median plane, where the non-individual spectral cues can increase vertical uncertainty (see 0-degree elevation target in column 4 of Fig. 5). In the frontal area, the vertical localization mapping using dynamic non-individual cues turned out to be compressed and clearly worse than with static individual cues, cf. Figure 4. The results suggest that dynamic cues improve auditory-visual localization with non-individual HRTFs in the horizontal dimension, but impairments in the vertical dimension can remain, particularly regarding local confusions and uncertainty in the frontal area. Dynamic cues greatly reduced the vertical LCR in the passive open-headphone condition, as head movements allow to compensate (to a certain degree) for the direction-specific distortions of the individual HRTF.
As expected in an audio-visual localization task, responses were mostly clustered around the visual cues [16, 17], but certain stimuli caused auditory events between visual anchors. This is particularly clear for the two binaural rendering conditions and the open-headphone condition in the static localization experiment, cf. azimuth responses between grid lines (visual anchors) in Figure 3 (top). Likely, this can be explained by inconclusive auditory localization cues in static listening conditions, e.g. due to disturbing room reflections for some target directions, and by distortions of the listener’s HRTF in case of the open-headphone condition.
Regarding the research question RQ3, the present study addressed how the vertical density of visible loudspeakers affects localization with (non-)individual HRTFs. Two different vertical spacings were included (30 degrees vs. 15 degrees), as mostly the vertical precision is known to degrade for localization with non-individual HRTFs [3, 14]. Multimodal response distributions were observed for both the 15-degree and the 30-degree vertical loudspeaker spacings, see e.g. responses to dynamic binaural rendering conditions in Figures 4 and 5. A likely explanation is that whenever the auditory resolution was insufficient to uniquely associate the auditory event with a visual cue, localization responses cluster around all plausible source locations. Unimodal response distributions were observed when the auditory cue was uniquely associated with a visual cue, see e.g. the response distributions of the open-ear reference condition in Figure 5. The 15-degree vertical loudspeaker spacing significantly increased the LCR compared to the30-degree spacing across all reproduction methods, except for the dynamic open-ear reference, see Figure 7. The results confirm that the 15-degree vertical spacing serves as a control condition when comparing the localization of virtual and real sound sources, as only the dynamic open-ear reference condition allowed for vanishing LCRs.
Note that a limitation of our study design is that static and dynamic binaural rendering relied on slightly different room acoustic reproduction methods (measured BRIR vs. measured Ambisonic room impulse response). In principle, static binaural rendering conditions could also be implemented by limiting the range of motion in a dynamic rendering system, but in the present study this would have excluded the individualized BRIR condition. Furthermore, measured BRIRs represent the reference in terms of reproducing room acoustic properties, e.g. preserving the direct-to-reverberant energy ratio. Ideally, future work should include high-resolution individual HRTFs in dynamic binaural rendering conditions. Dynamic binaural rendering with individual HRTFs can be expected to perform comparable or better than the dynamic open-headphone conditions included in this study, when taking the results of the static experiment into consideration. Lastly, another limitation of this study is that the toy gun as a pointing device does not provide direct visual feedback on the pointing direction. Although previous research has demonstrated a high pointing accuracy using the toy gun pointing method [30], virtual reality (VR) interfaces can provide visual feedback to participants during a pointing task and enable a more sophisticated localization response collection (e.g. direction, distance, and source width) [57].
5 Conclusion
This study investigated auditory-visual localization of real and virtual sound sources in a loudspeaker studio room using open headphones. Besides static binaural rendering with measured (non-)individual binaural room impulse responses, dynamic rendering using high-resolution non-individual dummy head HRTFs (2 × 2 degrees in azimuth and elevation) and Ambisonic room impulse responses (measured in first order, upmixed to fifth order) was employed. Visual cues on possible source locations were present in the form of visible loudspeakers in the studio room, to test the effect of (non-)individual HRTF cues in a congruent audio-visual environment. The visible loudspeakers were vertically spaced by 30 degrees or 15 degrees, while horizontal spacings were 30 degrees or larger.
In vertical planes, neighboring loudspeakers were confused more often when using non-individual vs. individual HRTF cues in static binaural rendering conditions. While dynamic binaural rendering reduced horizontal local confusion rates for non-individual HRTFs, the vertical local confusion rates remained high in the frontal area. Moreover, distorted HRTF cues in the passive open-headphone condition caused higher vertical local confusion rates in comparison to the open-ear reference condition. Loudspeakers spaced vertically by 30 degrees can be discriminated rather well even in binaural rendering with non-individual HRTFs or when listening through (passive) open headphones. The 15-degree vertical spacing resulted in increased confusion rates for all reproduction conditions except dynamic listening with open ears.
The results of this study indicate that (i) auditory-visual localization in studio environments benefits from individual HRTFs in both static and dynamic listening conditions to reduce vertical localization errors, and that (ii) research on optimization of generic HRTFs should focus on vertical localization in the frontal median plane, which seems to be the most critical area even under dynamic listening conditions.
Funding
This work was partly funded by the Austrian Science Fund (FWF) under grant number P 35254-N, Envelopment in Immersive Sound Reinforcement (EnImSo).
Conicts of interest
The authors declare no conflict of interest.
Data availability statement
The research data associated with this article, the Python code to reproduce the figures, as well as additional figures are available in GitHub, under the reference [58].
References
- J.C. Makous, J.C. Middlebrooks: Two-dimensional sound localization by human listeners. The Journal of the Acoustical Society of America 87, 5 (1990) 2188–2200. [CrossRef] [PubMed] [Google Scholar]
- R.A. Butler, R.A. Humanski: Localization of sound in the vertical plane with and without high-frequency spectral cues. Perception & Psychophysics 51, 2 (1992) 182–186. [CrossRef] [PubMed] [Google Scholar]
- E.M. Wenzel, M. Arruda, D.J. Kistler, F.L. Wightman: Localization using nonindividualized head-related transfer functions. The Journal of the Acoustical Society of America 94, 1 (1993) 111–123. [Google Scholar]
- A.W. Bronkhorst: Localization of real and virtual sound sources. The Journal of the Acoustical Society of America 98, 5 (1995) 2542–2553. [Google Scholar]
- P. Majdak, M.J. Goupell, B. Laback: 3-d localization of virtual sound sources: effects of visual environment, pointing method, and training. Attention, Perception, & Psychophysics 72, 2 (2010) 454–469. [CrossRef] [PubMed] [Google Scholar]
- H. Bahu, T. Carpentier, M. Noisternig, O. Warusfel: Comparison of different egocentric pointing methods for 3d sound localization experiments. Acta Acustica United with Acustica 102, 1 (2016) 107–118. [CrossRef] [Google Scholar]
- ITU-R: Methods for the subjective assessment of small impairments in audio systems, 2015, ITU-R BS.1116-3. [Google Scholar]
- M. Zaunschirm, M. Frank, F. Zotter: Binaural rendering with measured room responses: first-order ambisonic microphone vs. dummy head. Applied Sciences 10, 5 (2020) 1631. [CrossRef] [Google Scholar]
- I. Engel, C. Henry, S.V. Amengual Garí, P.W. Robinson, L. Picinali: Perceptual implications of different ambisonics-based methods for binaural reverberation. The Journal of the Acoustical Society of America 149, 2 (2021) 895–910. [CrossRef] [PubMed] [Google Scholar]
- G.R. VandenBos: APA Dictionary of Psychology. American Psychological Association, 2007. [Online]. Available: https://dictionary.apa.org/. [Google Scholar]
- J. Blauert: Spatial Hearing: The Psychophysics of Human Sound Localization. MIT Press, 1997. [Google Scholar]
- J. Blauert: The Technology of Binaural Listening. Springer, 2013. [CrossRef] [Google Scholar]
- F.L. Wightman, D.J. Kistler: Headphone simulation of free-field listening. II: psychophysical validation. The Journal of the Acoustical Society of America 85, 2 (1989) 868–878. [CrossRef] [PubMed] [Google Scholar]
- Z. Ben-Hur, D. Alon, P.W. Robinson, R. Mehra: Localization of virtual sounds in dynamic listening using sparse HRTFs, in: Proceedings of the AES International Conference on Audio for Virtual and Augmented Reality, Online, August 2020. [Google Scholar]
- C. Valzolgher, M. Alzhaler, E. Gessa, M. Todeschini, P. Nieto, G. Verdelet, R. Salemme, V. Gaveau, M. Marx, E. Truy, P. Barone: The impact of a visual spatial frame on real sound-source localization in virtual reality. Current Research in Behavioral Sciences 1 (2020) 100003. [CrossRef] [Google Scholar]
- A. Ahrens, K.D. Lund, M. Marschall, T. Dau: Sound source localization with varying amount of visual information in virtual reality. PLoS One 14, 3 (2019) 1–19. [Google Scholar]
- T. Huisman, A. Ahrens, E. MacDonald: Ambisonics sound source localization with varying amount of visual information in virtual reality. Frontiers in Virtual Reality 2 (2021) 722321. [CrossRef] [Google Scholar]
- A. Ahrens, K.D. Lund: Auditory spatial analysis in reverberant multi-talker environments with congruent and incongruent audio-visual room information. The Journal of the Acoustical Society of America 152, 3 (2022) 1586–1594. [CrossRef] [PubMed] [Google Scholar]
- G.H. Recanzone: Interactions of auditory and visual stimuli in space and time. Hearing Research 258, 1, 2 (2009) 89–99. [CrossRef] [PubMed] [Google Scholar]
- K.P. Körding, U. Beierholm, W.J. Ma, S. Quartz, J.B. Tenenbaum, L. Shams: Causal inference in multisensory perception. PLoS One 2, 9 (2007) e943. [CrossRef] [PubMed] [Google Scholar]
- D. Leakey: Some measurements on the effects of interchannel intensity and time differences in two channel sound systems. The Journal of the Acoustical Society of America 31, 7 (1959) 977–986. [CrossRef] [Google Scholar]
- V. Pulkki: Virtual sound source positioning using vector base amplitude panning. Journal of the Audio Engineering Society 45, 6 (1997) 456–466. [Google Scholar]
- F. Zotter, M. Frank: Ambisonics. SpringerOpen, 2019. [Online]. Available: https://doi.org/10.1007/978-3-030-17207-7. [CrossRef] [Google Scholar]
- A. Hofmann, N. Meyer-Kahlen, S.J. Schlecht, T. Lokki: Audiovisual congruence and localization performance in virtual reality: 3d loudspeaker model vs. human avatar. Journal of Audio Engineering Society 72 (2024) 679–690. [CrossRef] [Google Scholar]
- P. Lladó, T. Mckenzie, N. Meyer-Kahlen, S. Schlecht: Predicting perceptual transparency of head-worn devices. Journal of Audio Engineering Society 70, 7/8 (2022) 585–600. [CrossRef] [Google Scholar]
- A. Mülleder, F. Zotter: Ultralight circumaural open headphones, in: Proceedings of the 154th AES Convention, Helsinki, Finland, May 2023. [Online]. Available: https://www.aes.org/e-lib/browse.cfm?elib=22075. [Google Scholar]
- A. Neidhardt, A.M. Zerlik: The availability of a hidden real reference affects the plausibility of position-dynamic auditory AR. Frontiers in Virtual Reality 2 (2021) 678875. [CrossRef] [Google Scholar]
- S.A. Wirler, N. Meyer-Kahlen, S.J. Schlecht: Towards transfer-plausibility for evaluating mixed reality audio in complex scenes, in: Proceedings of the AES International Conference on Audio for Virtual and Augmented Reality, 2020. [Google Scholar]
- M. Frank, L. Mohr, A. Sontacchi, F. Zotter: Flexible and intuitive pointing method for 3-d auditory localization experiments, in: Proceedings of the AES 38th International Conference on Sound Quality Evaluation, Piteå, Sweden, June 2010. [Google Scholar]
- M. Frank: Localization using different amplitude-panning methods in the frontal horizontal plane, in: Proceedings of the EAA Joint Symposium on Auralization and Ambisonics, Berlin, Germany, April 2014. [Online]. Available: https://doi.org/10.14279/depositonce-8. [Google Scholar]
- J.-M. Pernaux, M. Emerit, R. Nicol: Perceptual evaluation of binaural sound synthesis: the problem of reporting localization judgments, in: Proceedings of the 114th AES Convention, Amsterdam, The Netherlands, March 2003. [Google Scholar]
- ITU: Recommendation ITU-R BS.2051-3. ITU, Technical Report, May 2022. [Online]. Available: https://www.itu.int/rec/R-REC-BS.2051. [Google Scholar]
- S. Riedel, M. Frank, F. Zotter: The effect of temporal and directional density on listener envelopment. Journal of Audio Engineering Society 71, 7/8 (2023)455–467. [CrossRef] [Google Scholar]
- J.C. Middlebrooks: Virtual localization improved by scaling nonindividualized external-ear transfer functions in frequency. The Journal of the Acoustical Society of America 106, 3 (1999) 1493–1510. [CrossRef] [PubMed] [Google Scholar]
- H. Møller, M.F. Sørensen, D. Hammershøi, C.B. Jensen: Head-related transfer functions of human subjects. Journal of Audio Engineering Society 43, 5 (1995)300–321. [Google Scholar]
- J. Oberem, B. Masiero, J. Fels: Experiments on authenticity and plausibility of binaural reproduction via headphones employing different recording methods. Applied Acoustics 114 (2016) 71–78. [CrossRef] [Google Scholar]
- C. Armstrong, L. Thresh, D. Murphy, G. Kearney: A perceptual evaluation of individual and non-individual HRTFs: a case study of the sadie II database. Applied Sciences 8, 11 (2018) 2029. [CrossRef] [Google Scholar]
- O.S. Rummukainen, T. Robotham, E.A. Habets: Head-related transfer functions for dynamic listeners in virtual reality. Applied Sciences 11, 14 (2021) 6646. [CrossRef] [Google Scholar]
- B. Bernschütz: A spherical far field HRIR/HRTF compilation of the neumann ku 100, in: Proceedings of the 39th DAGA, 2013, pp. 592–595. [Google Scholar]
- H.S. Braren, J. Fels: A High-Resolution Head-Related Transfer Function Data Set and 3D-Scan of KEMAR, 2020. [Google Scholar]
- A. Lindau, S. Weinzierl: On the spatial resolution of virtual acoustic environments for head movements in horizontal, vertical, and lateral direction, in: Proceedings of the EAA Symposium on Auralization, Espoo, Finland, June 2009. [Google Scholar]
- J.M. Arend, C. Pörschmann, S. Weinzierl, F. Brinkmann: Magnitude-corrected and time-aligned interpolation of head-related transfer functions, in: IEEE/ACM Transactions on Audio, Speech, and Language Processing, 2023. [Google Scholar]
- S. Riedel: HRIR convolver VST plug-in, 2023. [Online]. Available: https://git.iem.at/audioplugins/IEMPluginSuite/-/tree/HRIRConvolver. [Google Scholar]
- S. Yairi, Y. Iwaya, Y. Suzuki: Estimation of detection threshold of system latency of virtual auditory display. Applied Acoustics 68, 8 (2007) 851–863. [CrossRef] [Google Scholar]
- M. Brandner, M. Frank, D. Rudrich: Dirpat–database and viewer of 2d/3d directivity patterns of sound sources and receivers, in: Audio Engineering Society Convention 144. Audio Engineering Society, 2018. [Online]. Available: https://www.aes.org/e-lib/online/browse.cfm?elib=19538. [Google Scholar]
- C. Schörkhuber, M. Zaunschirm, R. Höldrich: Binaural rendering of ambisonic signals via magnitude least squares. Proceedings of DAGA 44 (2018) 339–342. [Google Scholar]
- N. Meyer-Kahlen, S.J. Schlecht, T. Lokki: Clearly audible room acoustical differences may not reveal where you are in a room. The Journal of the Acoustical Society of America 152, 2 (2022) 877–887. [CrossRef] [PubMed] [Google Scholar]
- D. Poirier-Quinot, M.S. Lawless, P. Stitt, B.F. Katz: HRTF performance evaluation: methodology and metrics for localisation accuracy and learning assessment, in: Advances in Fundamental and Applied Research on Spatial Audio, B.F. Katz, P. Majdak, Eds. IntechOpen, Rijeka 2022, ch. 3. [Online]. Available: https://doi.org/10.5772/intechopen.104931. [Google Scholar]
- R. Baumgartner, P. Majdak, B. Laback: Modeling sound-source localization in sagittal planes for human listeners. The Journal of the Acoustical Society of America 136, 2 (2014) 791–802. [CrossRef] [PubMed] [Google Scholar]
- P.M. Hofman, J.G. Van Riswick, A.J. Van Opstal, Relearning sound localization with new ears. Nature Neuroscience, 1, 5 (1998) 417–421. [CrossRef] [PubMed] [Google Scholar]
- N. Cliff, Ordinal Methods for Behavioral Data Analysis. Psychology Press, 2014. [CrossRef] [Google Scholar]
- K. Meissel, E.S. Yao: Using Cliff’s delta as a non-parametric effect size measure: an accessible web app and R tutorial. Practical Assessment, Research, and Evaluation 29, 1 (2024). [Online]. Available: https://doi.org/10.7275/pare.1977. [Google Scholar]
- M. Frank, S. Riedel: Simulation study on the effect of (non-) individual HRTFs and Ambisonics on median plane localization, in: Proceedings of the DAGA, Vol. 50. [Online]. Available: https://pub.dega-akustik.de/DAGA_2024/files/upload/paper/203.pdf. [Google Scholar]
- A. Mülleder, M. Romanov, N. Meyer-Kahlen, F. Zotter: Do-it-yourself headphones and development platform for augmented-reality audio, in: AES 2023 International Conference on Spatial and Immersive Audio. Audio Engineering Society, 2023. [Google Scholar]
- J. Jiang, B. Xie, H. Mai, L. Liu, K. Yi, C. Zhang: The role of dynamic cue in auditory vertical localisation. Applied Acoustics 146 (2019) 398–408. [CrossRef] [Google Scholar]
- B. Xie, L. Liu, J. Jiang, C. Zhang, T. Zhao: Auditory vertical localization in the median plane with conflicting dynamic interaural time difference and other elevation cues. The Journal of the Acoustical Society of America 154, 3 (2023) 1770–1786. [CrossRef] [PubMed] [Google Scholar]
- S. Fargeot, A. Vidal, M. Aramaki, R. Kronland-Martinet: Perceptual evaluation of an ambisonic auralization system of measured 3d acoustics. Acta Acustica 7 (2023) 56. [CrossRef] [EDP Sciences] [Google Scholar]
- S. Riedel: Supplementary data and code, 2023. [Online]. Available: https://github.com/stefanriedel/Localization_RealVirtual_AuditoryVisual. [Google Scholar]
Cite this article as: Riedel S. Frank M. & Zotter F. 2025. Effect of HRTFs and head motion on auditory-visual localization in real and virtual studio environments. Acta Acustica, 9, 21. https://doi.org/10.1051/aacus/2025005.
All Tables
Quadrant error rates (QER) for static localization. The frontal direction (loudspeaker 1), the rear direction (loudspeaker 5), and the average across all 25 directions is evaluated. In dynamic localization, the QERs were 0% for all reproduction methods.
All Figures
|
Figure 1 Participant wearing circumaural open headphones during the experiment task in a studio room (RT30 = 0.2 s). Motion-tracking is enabled via an OptiTrack system (NaturalPoint Inc.) with markers attached to the headphones and the toy gun. |
| In the text | |
|
Figure 2 Schematic representation of loudspeaker directions in the experiment: 3-D view (top) and 2-D projection (bottom) showing loudspeakers as circles with their coordinates listed (azimuth and elevation in degrees). |
| In the text | |
|
Figure 3 Azimuth component of localization responses in the static vs. dynamic listening experiment for loudspeakers at 0, 30, and 60 degrees elevation (N = 16). Responses to the different target elevations are displayed in different colors (gold: 0 degree, red: 30 degree, purple: 60 degree) and are horizontally spaced around a corresponding target azimuth. The average local confusion rate ( |
| In the text | |
|
Figure 4 Elevation component of localization responses in the static vs. dynamic listening experiment for sources in the median vertical plane. Diamonds indicate median across subjects (N = 16). In the frontal vertical plane, non-individual binaural conditions suffer from an upward bias in static and dynamic rendering. The local confusion rate (LCR) is reported per target loudspeaker together with the average local confusion rate ( |
| In the text | |
|
Figure 5 Elevation component of localization responses in the static (top) vs. dynamic (bottom) listening experiment for sources in ±90 degree azimuth vertical planes. The sources are vertically-spaced by 30 degrees in the left hemisphere (rows 1 and 3) and by 15 degrees in the right hemisphere (rows 2 and 4). Diamonds indicate median across subjects (N = 16). The local confusion rate (LCR) is reported per target loudspeaker alongside with the average local confusion rate ( |
| In the text | |
|
Figure 6 Local confusion rate (LCR) in the horizontal (a,b) and vertical (c,d) dimension of the static (a,c) and dynamic (b,d) auditory-visual localization experiment (N = 16). Violin plots show distributions, and boxplots show medians, interquartile ranges, and adjacent values. Horizontal lines indicate statistically significant differences (p < 0.05, Bonferroni-Holm corrected). Asterisks (*) indicate statistically significant differences (p < 0.05, Bonferroni-Holm corrected) between dynamic and static conditions for open ears, open headphones, and KU100 rendering. Static conditions: Open ears (Op. Ear), open headphones (Op. Hp.), individual BRIR (Indiv.), and KU100 BRIR. Dynamic conditions: Open ears (Op. Ear), open headphones (Op. Hp.), KEMAR HRIR, and KU100 HRIR. |
| In the text | |
|
Figure 7 Local confusion rate (LCR) in the static (a) and dynamic (b) auditory-visual localization experiments for the 15-degree and 30-degree vertical spacing of sources in the frontal hemifield (N = 16). Boxplots show medians, interquartile ranges, and adjacent values. Horizontal lines indicate statistically significant differences (p < 0.05, Bonferroni-Holm corrected). |
| In the text | |
Current usage metrics show cumulative count of Article Views (full-text article views including HTML views, PDF and ePub downloads, according to the available data) and Abstracts Views on Vision4Press platform.
Data correspond to usage on the plateform after 2015. The current usage metrics is available 48-96 hours after online publication and is updated daily on week days.
Initial download of the metrics may take a while.