Figure 12
Download original image
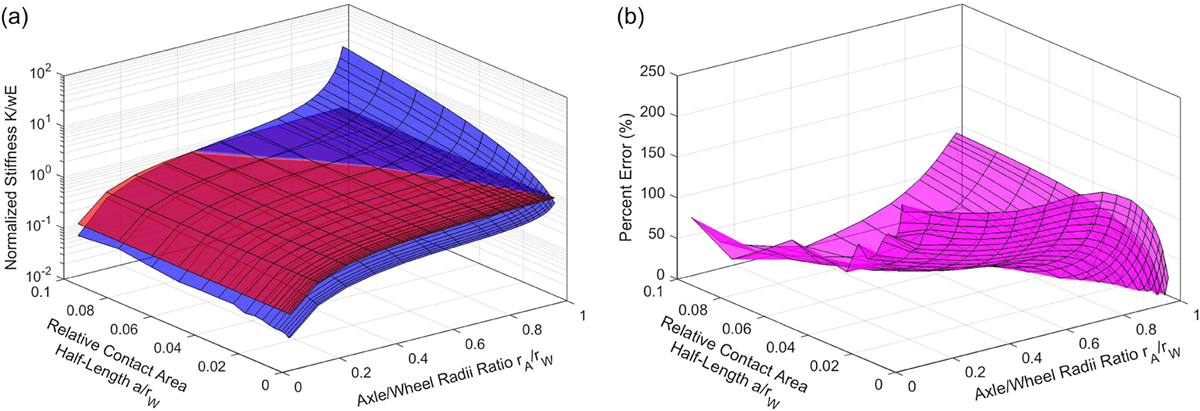
(a) Normalized wheel stiffness: FE model results (blue) vs. an equivalent trapezoidal prism (red). Plotted on a logarithmic z-scale (base 10). (b) Percent error between the FE model results and equivalent trapezoidal prism.
Current usage metrics show cumulative count of Article Views (full-text article views including HTML views, PDF and ePub downloads, according to the available data) and Abstracts Views on Vision4Press platform.
Data correspond to usage on the plateform after 2015. The current usage metrics is available 48-96 hours after online publication and is updated daily on week days.
Initial download of the metrics may take a while.