Figure 10
Download original image
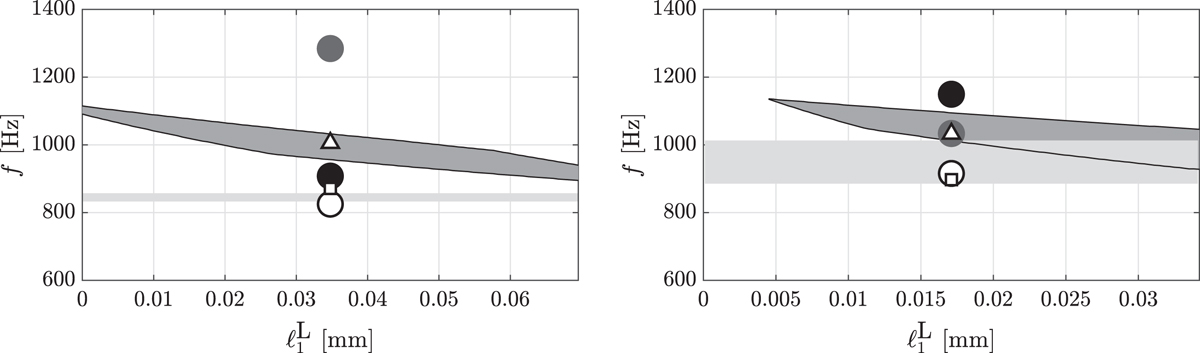
Comparison of three analysis methods. Successful asymmetric division (dark grey region) of an alto saxophone high C on left (written pitch, 311 Hz) and G♯ on right (written pitch, 246 Hz) fingerings for different initial cell length ![]() . The first three tonehole pair cell characteristic frequencies
. The first three tonehole pair cell characteristic frequencies ![]() are denoted
are denoted ![]()
![]()
![]() . The average of the first three Π-cells and of the entire lattice are provided by Δ and □. The cutoff transition band
. The average of the first three Π-cells and of the entire lattice are provided by Δ and □. The cutoff transition band ![]() is shown in light grey.
is shown in light grey.
Current usage metrics show cumulative count of Article Views (full-text article views including HTML views, PDF and ePub downloads, according to the available data) and Abstracts Views on Vision4Press platform.
Data correspond to usage on the plateform after 2015. The current usage metrics is available 48-96 hours after online publication and is updated daily on week days.
Initial download of the metrics may take a while.