Figure 5
Download original image
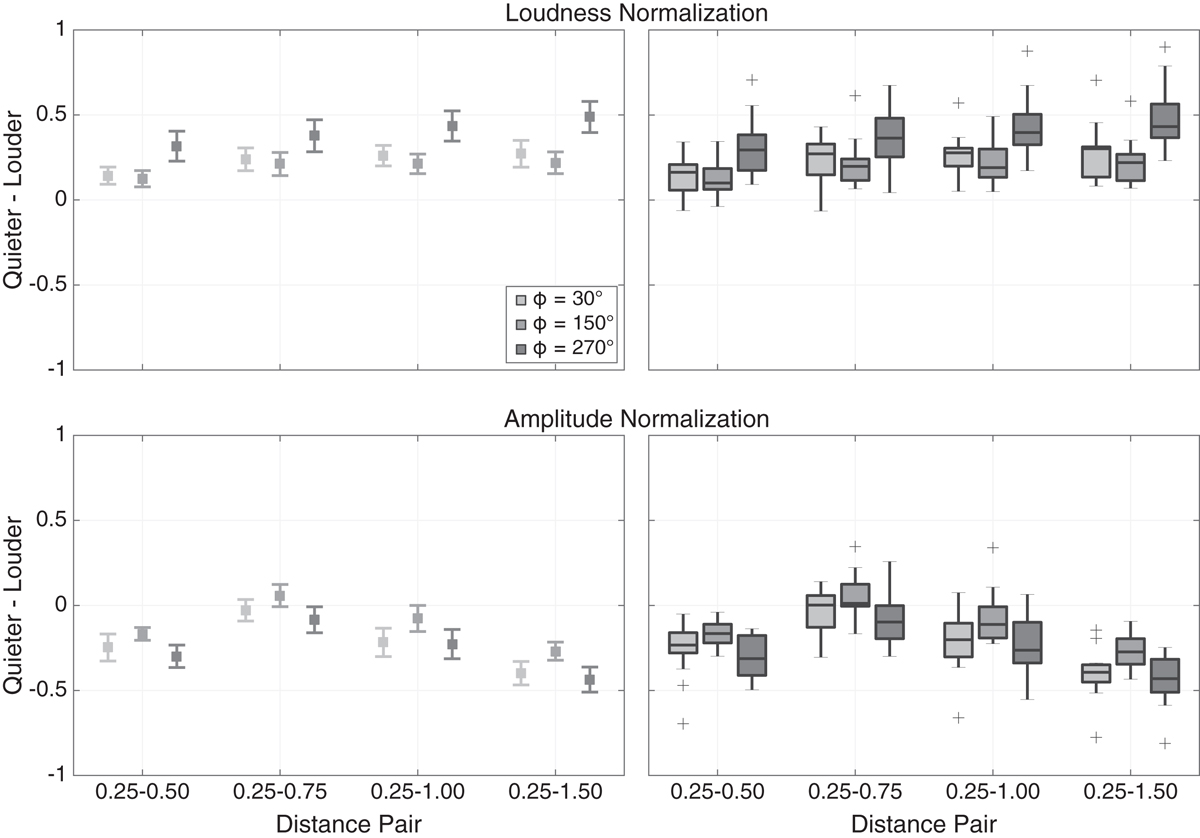
Mean ratings of the SAQI assessment for loudness (left) and interindividual variation in the ratings (right) as a function of distance pair (abscissa) and nominal source azimuth (shades of gray), pooled over presentation order and separated with respect to normalization method. The error bars in the mean plot (left) display 95% confidence intervals based on the respective one-sample t tests comparing the condition means against 0. The box plots (right) show the median and the (across participants) interquartile range (IQR) per condition; whiskers display 1.5 × IQR below the 25th or above the 75th percentile and outliers are indicated by plus signs.
Current usage metrics show cumulative count of Article Views (full-text article views including HTML views, PDF and ePub downloads, according to the available data) and Abstracts Views on Vision4Press platform.
Data correspond to usage on the plateform after 2015. The current usage metrics is available 48-96 hours after online publication and is updated daily on week days.
Initial download of the metrics may take a while.