Open Access
Figure 4
Download original image
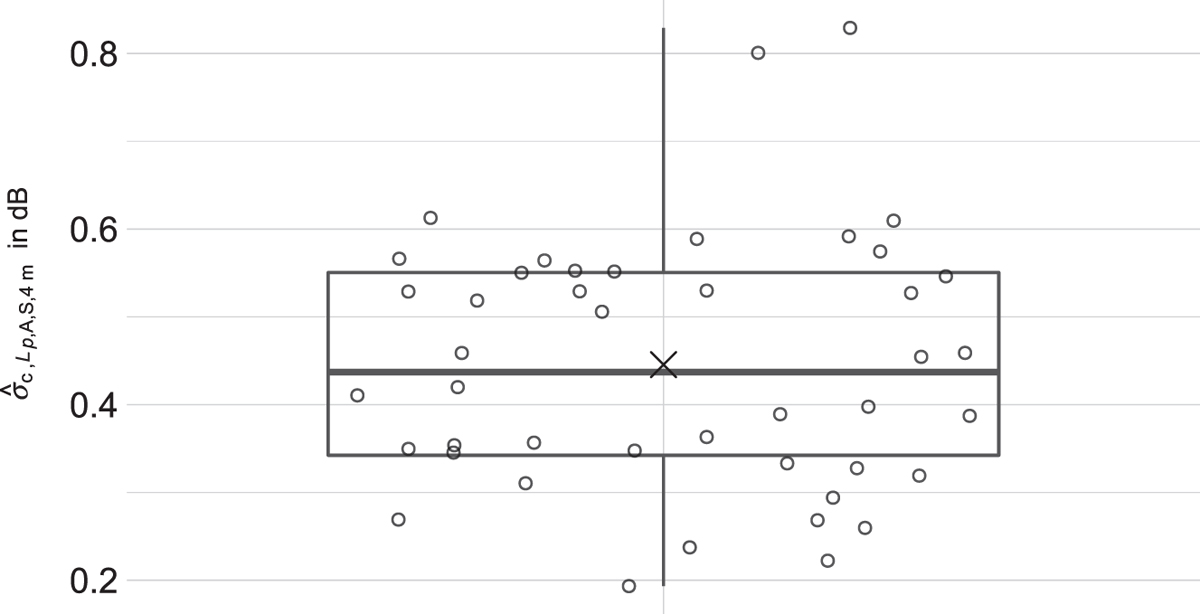
Boxplot of ![]() for all 44 measurement paths. The results for the individual calculations are indicated as circles, the mean value is represented by x.
for all 44 measurement paths. The results for the individual calculations are indicated as circles, the mean value is represented by x.
Current usage metrics show cumulative count of Article Views (full-text article views including HTML views, PDF and ePub downloads, according to the available data) and Abstracts Views on Vision4Press platform.
Data correspond to usage on the plateform after 2015. The current usage metrics is available 48-96 hours after online publication and is updated daily on week days.
Initial download of the metrics may take a while.