Figure 7
Download original image
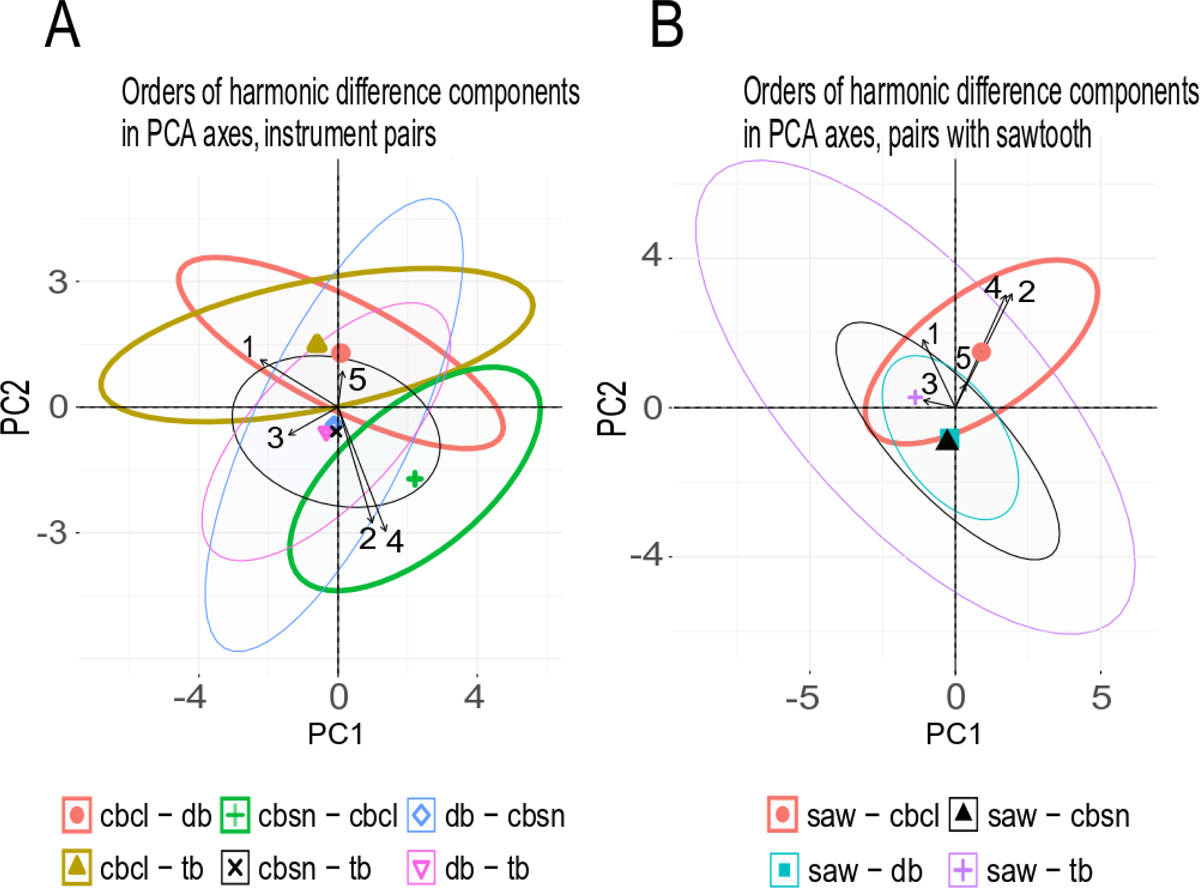
PCA biplots of the first two principal components with the sharpened dataset (statistically significant tuning deviation p < 0.05) A: tone pairs with instruments, B: tone pairs including sawtooth waveform. The clusters of data points are indicated with confidence ellipses. Pairs with contrabass clarinet are highlighted with thick line type. For correlations between HDC components (arrows) and the PC axes see Section 3.5.
Current usage metrics show cumulative count of Article Views (full-text article views including HTML views, PDF and ePub downloads, according to the available data) and Abstracts Views on Vision4Press platform.
Data correspond to usage on the plateform after 2015. The current usage metrics is available 48-96 hours after online publication and is updated daily on week days.
Initial download of the metrics may take a while.