Open Access
Figure 12
Download original image
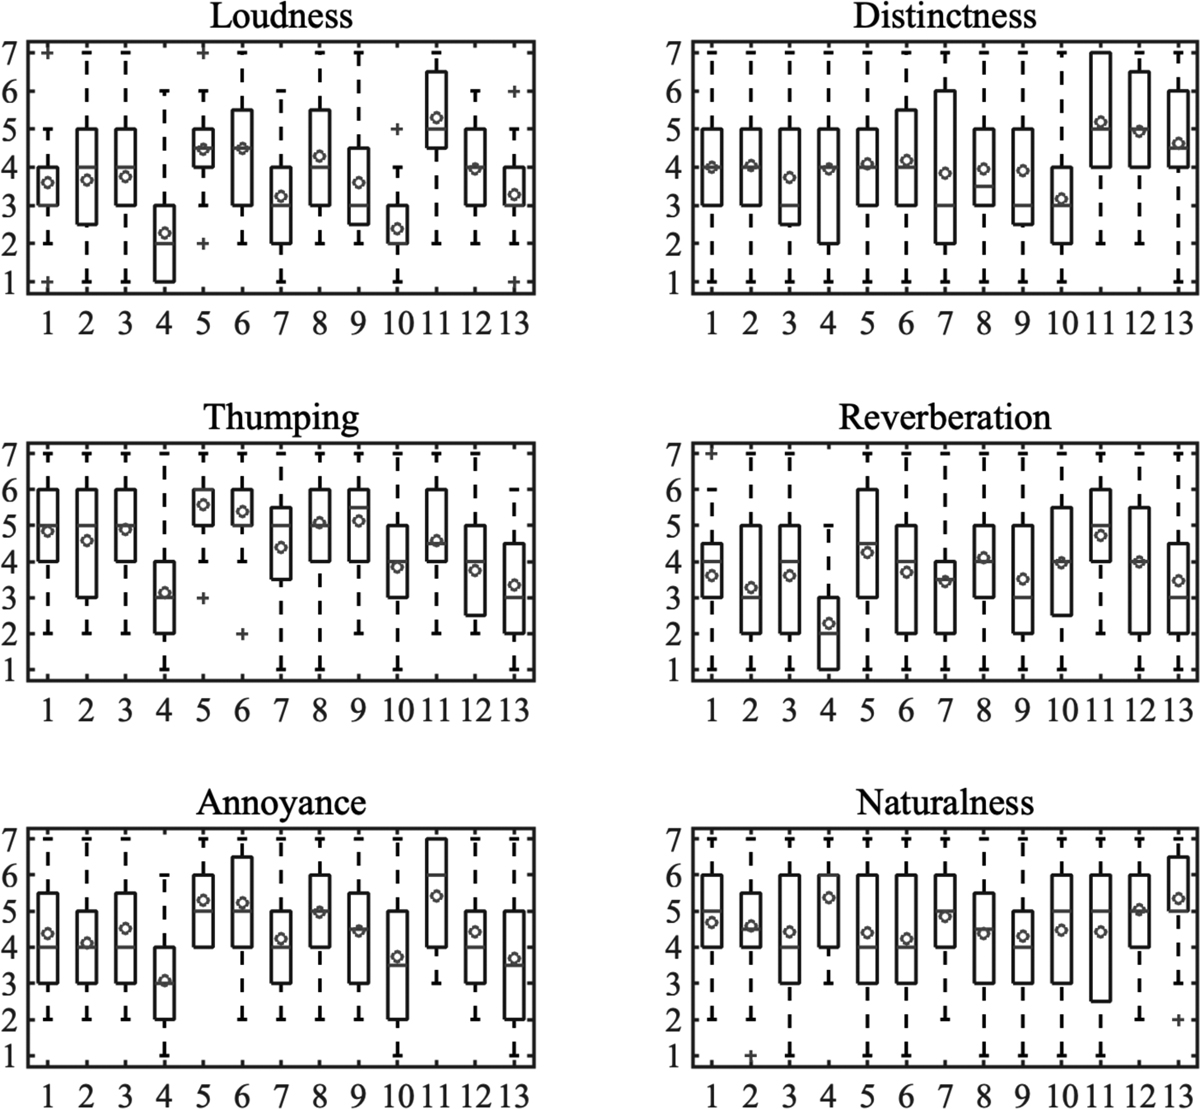
Listening test results for all the participants and all sound samples. The horizontal axis represents the floor sample, and the vertical axis shows the rating values. The circles show the mean values of the data for each sound sample in each category.
Current usage metrics show cumulative count of Article Views (full-text article views including HTML views, PDF and ePub downloads, according to the available data) and Abstracts Views on Vision4Press platform.
Data correspond to usage on the plateform after 2015. The current usage metrics is available 48-96 hours after online publication and is updated daily on week days.
Initial download of the metrics may take a while.