| Issue |
Acta Acust.
Volume 10, 2026
|
|
|---|---|---|
| Article Number | 29 | |
| Number of page(s) | 13 | |
| Section | Virtual Acoustics | |
| DOI | https://doi.org/10.1051/aacus/2026024 | |
| Published online | 21 April 2026 | |
Scientific Article
Use of audio-visual interactive virtual environments to avoid the room divergence effect in office-like environments
1
Institut für Hörtechnik und Audiologie, Jade Hochschule Oldenburg, Ofener Str. 16/19, 26121 Oldenburg, Germany
2
Acoustics Group, Carl von Ossietzky University Oldenburg, Carl-von-Ossietzky-Str. 9-11, 26129 Oldenburg, Germany
3
Cluster of Excellence “Hearing4All”, Oldenburg, Germany
4
Department of Psychology, Clinical Psychology and Psychotherapy, University of Regensburg, Universitätsstr. 31, 93053 Regensburg, Germany
* Corresponding author: This email address is being protected from spambots. You need JavaScript enabled to view it.
Received:
10
November
2025
Accepted:
10
March
2026
Abstract
This study examines whether auditory perception in audio-visual interactive virtual environments (IVE) is affected by the subjects’ awareness of being in a room with different physical properties and acoustic characteristics compared to the visually rendered room. This could potentially lead to the room divergence effect (RDE). We investigated whether ratings of room-acoustic attributes made within an audio-visual IVE were influenced by the room in which the IVE was used, i.e., the playback room, which was either congruent or divergent from the visually rendered room. The divergent room differed in terms of size, acoustic characteristics, and visual appearance. Participants rated room-acoustic attributes for different head-tracked binaural auralisations. The results show that for several room-acoustic attributes, similar ratings were obtained for both rooms, i.e., we found no effect of the room in which the listening test was performed. The only exception was the perceived source distance, where a small but statistically significant underestimation was found in the divergent room compared to the congruent room. Given the small difference in median scores, this effect may, however, be considered low in relevance. We conclude that audio-visual IVEs can create a convincing illusion of the room that resists influence from the playback room.
Key words: Binaural auralisation / Interactive virtual environments / Binaural room impulse responses / Room acoustic simulation / Room divergence effect
© The Author(s), Published by EDP Sciences, 2026
 This is an Open Access article distributed under the terms of the Creative Commons Attribution License (https://creativecommons.org/licenses/by/4.0), which permits unrestricted use, distribution, and reproduction in any medium, provided the original work is properly cited.
1 Introduction
In many applications of virtual environments, the goal is to perceive a space without being physically present in it. Gaming serves as a popular example, where the illusion of being in another location is created through audio-visual means. In the field of room acoustics, one objective is to assess a room even if it does not physically exist. For virtual reality (VR) scenarios, including social interactions with virtual agents, the goal is to enhance social realism and plausibility. Common across all these applications is the need to increase the realism of the IVE.
A room can be auralised over headphones (binaural auralisation) by using human anthropometric characteristics contained in head-related transfer functions (HRTFs) and incorporating spatial conditions through binaural room impulse responses (BRIRs). An auralisation enables the listener to perceive a source in the room as it would be in reality [1, 2]. This perception can also be termed an auditory illusion [3], where a virtual source is perceived as real.
There are several paradigms for evaluating binaural auralisations, including authenticity and plausibility. Meyer-Kahlen [4] provides a comprehensive overview and discussion of these differences. The following summarises these paradigms, and some essential aspects are discussed.
Auralisations are considered perceptually authentic if they are indistinguishable from their real counterparts, referred to as the external reference. In Brinkmann et al. [1], participants underwent an ABX test comparing auralisations based on individually measured BRIRs to real loudspeaker playback across different rooms. Optimal conditions, such as using individual BRIRs and ensuring consistent headphone positioning after measuring the headphone impulse responses, were established. This approach aimed to replicate real acoustic conditions as accurately as possible. While trained listeners found the auralisations authentic with speech stimuli, differences were noted with pulsed pink noise stimuli. The time-consuming nature of measuring individual BRIRs for various head-over-torso orientations means that this approach may not be practical for all studies.
Plausibility in the field of acoustics is a different paradigm, focusing on the credibility of the perceived acoustic stimuli. Two different methods and therefore definitions are frequently used to test for plausibility in the evaluation of binaural auralisations. One concept, introduced by Kuhn-Rahloff [5], suggests that plausibility is determined by comparing perceived objects to an internal reference, which is shaped by an individual’s prior experiences. Following this definition, plausibility can be rated on a scale, see e.g. [6–8]. This means that one assumes that there may be different degrees of plausibility. For this definition, it is also possible that a high level of plausibility is achieved for a simulation that is unrelated to a real-life scenario. Auditory illusion is, therefore, not a prerequisite to achieve plausibility for this specific definition.
Lindau and Weinzierl [9] defined plausibility as the extent to which a listener’s expectation aligns with the intended real-life acoustic event. The relation to the real world is therefore included, and the intention is to see if a simulation can evoke an auditory illusion. When listening to an auralised or real sound source, participants need to repeatedly answer one closed question, typically whether a reproduction was virtual, with the two possible answers “yes” and “no”. Using signal detection theory [10], a sensitivity index d′ can be calculated to assess the perceived plausibility. Plausibility is achieved when participants believe an auralisation is real, leading to low d′ values. This paradigm was used in several studies [9, 11–13] to assess the plausibility of auralisations.
However, particularly for applications in room acoustics, it is also important to examine the extent to which different auralisations deviate from a real sound source regarding specific room acoustic attributes. Therefore, validating the results obtained from a binaural auralisation and comparing them to those from a real loudspeaker is of considerable interest. Keidser et al. [14] provided the following definition of ecological validity in hearing science: “In hearing science, ecological validity refers to the degree to which research findings reflect real-life hearing-related function, activity, or participation.” This definition highlights the importance of ensuring that research outcomes apply to everyday hearing scenarios, thereby enhancing the relevance and utility of findings in practical settings. In relation to this definition, auralisations represent the practical setting, while the playback from a real loudspeaker serves as the real-life condition in an experiment designed to validate auralisations.
Blau et al. [15] conducted a study aimed at validating auralisations, where participants were asked to compare various auralisations to an open reference (a real loudspeaker in the room), using a multi-stimulus rating paradigm. The focus of this comparison was on room acoustic attributes, including reverberance, source width, source distance, source direction, and overall quality. Stärz et al. [2] conducted a similar study in which reproduction quality, reverberance, tone colour, loudness, source distance, plausibility and externalisation were rated. Instead of an open reference, a hidden reference was used, which was possible as extra-aural headphones were employed.
Compared to authenticity and plausibility [9], successfully evoking an auditory illusion is not a prerequisite for a multi-stimulus rating paradigm. However, more details about the deviations of auralisations from a real sound source can be revealed. Consequently, this enables a comparison between different auralisation methods, allowing for variations in the degrees of simplification in the auralisation process. The selection of a suitable auralisation method for a specific application can then be based on a trade-off between room acoustical attributes and effort. To determine whether an auditory illusion occurs, testing should be conducted using one of the paradigms mentioned above.
Externalisation is a key desired feature in virtual acoustics, as it involves perceiving an auditory event as being located outside the head, as in real life. For a recent overview, refer to Best et al. [16]. Externalisation does not necessarily depend on a perceived auditory illusion. However, Meyer-Kahlen [4] stated that externalisation is a prerequisite for auditory illusion, as internalised sounds would not be perceived as real.
Without including binaural differences created by the human head, body, and pinna, audio playback through headphones is primarily perceived as occurring inside the head, often referred to as internalisation. However, even when human anthropometric characteristics are considered, externalisation is not guaranteed [17]. Therefore, it is important to consider the effects that may alter the perceived externalisation of auralisations.
It has been suggested that the level of perceived externalisation and plausibility depends on a close correspondence between the auralised room and the playback room in which the observer is situated. For this study, we define a playback room as the physical location of a person while auralisations of the virtually rendered room are played back through headphones. It has been argued that being in a playback room that differs from the auralised room can reduce the perception of externalisation. This phenomenon is known as the Room Divergence Effect (RDE) [18]. This effect could be explained by conflicting expectations regarding different modalities, such as acoustics or visual appearance, between the playback room and the virtually rendered room. For a recent overview, see Brandenburg et al. [17].
The RDE has mainly been investigated in the context of a mismatch between the rendered audio and expectations based on the playback room in which a listener is placed, e.g. based on visual cues. Room divergence can lead to reduced externalisation if there is a visual mismatch between these rooms [17, 19]. The visual appearance of a room was found to have a significant effect on externalisation when the same auralisation is played back in visually different rooms [19]. Additionally, the visualisation of the room influenced externalisation more than the visual presence of the source.
Furthermore, the differential effects of acoustic and visual scenes, and their respective mismatches with the playback room, on externalisation were examined. Gil-Carvajal et al. [20] compared the room divergence of audio and visual stimuli from a reference room to either a small reverberant or a large anechoic room. To achieve this, they tested three groups in these three rooms, using pure visual room cues, pure auditory room cues, and combined visual and auditory room cues. When auditory room cues were investigated, a 500 ms noise burst was repeatedly used during the experiment to evoke auditory cues, allowing participants to explicitly perceive the room acoustics. The authors found that auditory characteristics had a greater influence on externalisation than visual characteristics. Additionally, the RDE was more pronounced for front and rear sound sources.
The RDE described above is based on a comparison of congruent and divergent audio-only or audio-visual representations. To test whether a visually congruent room model displayed via HMD is sufficient to minimise the RDE, we presented a visual room model via HMD in the congruent playback room. In a test with 21 participants, we found high externalisation ratings for nearly all BRIR sets, indicating the validity of the combination of a visual room displayed via HMD with auralisations of this room [2].
Creating the illusion of an acoustic space relies not only on the near-perfect reconstruction of acoustic stimuli in an auralisation but also significantly on the audio-visual context. Brandenburg et al. [17] argue that physically identical ear signals do not guarantee externalisation. However, adaptation to a new acoustic environment can occur rapidly [21]. It is important to note that the RDE is application-dependent, but is likely to encounter fewer challenges in VR than in AR [17].
In previous studies, we aimed at avoiding the RDE altogether by placing participants in the same room that was also rendered virtually. The virtual rendering itself was either purely auditory [15] or audio-visual [2, 11, 22]. When tested against real acoustic sources in the room, we demonstrated a high level of plausibility [11] and externalisation [2], as well as comparable perceptual ratings of room acoustical attributes between the real source in the room and its congruent virtual renderings [2, 22]. However, it remains an open question whether such high levels of plausibility and externalisation, as well as valid ratings of room acoustical attributes, can also be achieved when using audio-visual IVEs presented to observers in a different playback room, where observers are fully aware of their location. This consideration is important, as various scenarios exist, including the assessment of a room that does not physically exist, where the playback room cannot be identical to the virtually rendered room.
This study investigates whether an audio-visual IVE can be transferred to a different playback room without eliciting the RDE. To assess the validity of this transfer, ratings of room acoustical attributes, as well as of plausibility and externalisation, are used. More specifically, these attributes were rated in an audio-visual IVE in two different playback rooms. One room, referred to as the congruent room, was also simulated and rendered audio-visually and is therefore the virtually rendered room presented over HMD. In contrast, the other room, referred to as the divergent room, differed in size, visual appearance, and reverberation time. The following questions will be addressed: Does the room in which listeners engage with audio-visual IVEs affect their assessment of room acoustic parameters, as well as their sense of plausibility and externalisation? Furthermore, can one fully adapt to a virtual space, or does the playback room continue to exert some influence?
We hypothesise that the playback room has no influence on room acoustic ratings, externalisation or plausibility. Consequently, we assume that the audio-visual IVE is a sufficient substitute for the physical room.
2 Methods
We investigate whether the physical room in which audio-visual IVEs are used influences how listeners rate auralisations of a room with respect to room-acoustical attributes, plausibility, and externalisation. Here, we define the “playback room” as the physical room in which participants perceive the “virtually rendered room” in an audio-visual IVE. For a visualisation of these terms, see Figure 1. Importantly, no real loudspeaker signals are played back in the playback room, as we are not interested in comparing real room acoustics with auralised rooms in the current study. Participants are presented with head-tracked binaural auralisations via headphones. Potential influences of the playback room include its visual appearance, the acoustics experienced upon entry and while being in the room, and other sensory modalities. All of these factors have been associated with the RDE in earlier studies and may negatively affect auralisations [17].
 |
Figure 1. A block diagram, adapted from Stärz et al. [2], presenting an overview of the steps involved in generating the head-tracked binaural auralisations. |
To investigate potential negative influences on auralisations, we conducted a multi-stimulus rating experiment in which two playback rooms were used to present identical auralisations in an audio-visual IVE. One playback room matched the virtually rendered room, whereas the other was deliberately divergent. The divergent playback room differed in size, reverberation, visual appearance, and the participant’s position within the room. Auralisations and attributes were taken from a previous study in which auralisations based on simulations or measurements were rated alongside a real loudspeaker in the congruent room [2]. They are briefly reviewed below. It is worth noting that the participants in this study also took part in the previous study.
2.1 Auralisation details
To provide an overview of the stimuli used in the experiment, Figure 1 shows a block diagram of signal generation and audio rendering. Four main parts can be distinguished: The simulated room as the starting point, a set of pre-calculated data, the real-time rendering and the playback room as the location where the listening test took place.
2.1.1 Virtually rendered room
The room used in this study is a small lecture room at Jade Hochschule in Oldenburg, Germany. Its dimensions are 7.12 m × 11.94 m × 2.98 m. It has a window front with open curtains, a linoleum floor, an acoustically optimised ceiling and three plastered brick walls. For the auralisations, we used one source and receiver combination. The source was a loudspeaker (Genelec 8030b, Genelec Oy, Iisalmi, Finland) positioned at a height of 1.6 m and a distance of 4.3 m directly in front of the participant. The receiver position was central but slightly off-axis. The ear height was set to 1.3 m.
To create the audio-visual IVE, various room properties were extracted, including room dimensions and the position and form of interior objects such as desks. In addition, monaural room impulse responses were measured to adjust the absorption coefficients in the room acoustical model later on.
Also, the generation of the two measured BRIR sets (see Tab. 1) relied on measurements performed in this room, see Section 2.1.2 below.
Summary of the utilised BRIR sets.
2.1.2 Pre-computed data
To create head-tracked binaural auralisation used in the experiment, sets of BRIRs and headphone equalisation filters were pre-computed to be used by the real-time rendering later on. An overview of all BRIR sets used can be found in Table 1. Both measured and simulated BRIRs were used. All BRIR sets have in common that they were generated for multiple head-above-torso orientations, relative to one source position directly in front of the listener position (at an azimuth of 0°). This specific source position was chosen because, in previous studies, it was found to be the most challenging in terms of externalisation [19, 23]. Also, in the context of rating room acoustical attributes, frontal source positions are the most relevant ones.
2.1.3 Measured BRIRs
Two BRIR sets were measured. One measurement was made with a head and torso simulator (HATS, KEMAR type 45BB, GRAS Sound and Vibration A/S, Holte, Denmark), labelled “measHATS”, and the other one with a human participant. The latter condition, labelled “measHuman”, was already used in Stärz et al. [2, 11, 22] to assess the influence of using (realistic) hair and clothing in comparison to a HATS. We used self-made silicone earplugs with the HATS and PIRATE earplugs [24] with the human participant, both equipped with Micro-Electro-Mechanical Systems (MEMS) microphones (TDK type ICS-40619, TDK InvenSense, San Jose, CA, USA), to create a blocked ear condition. With the HATS, BRIR measurements were performed for 37 azimuthal head-above-torso orientations from −90° to 90° in 5° steps. Since the measurement of individual BRIRs at multiple head-above-torso orientations is a tedious task, the measurement on the human participant was limited to this one participant, and by using a reduced number of azimuthal head-above-torso orientations from −60° to 60° in 5° steps. To account for the difference in azimuth range between this measurement to the other BRIR sets, participants were instructed in writing to keep the virtual loudspeaker within their field of view throughout the listening test. The used HMD determines the field of view and is specified by the manufacturer as 110° [25]. Nevertheless, all datasets also contain data beyond these limits of ±55°.
2.1.4 Simulated BRIRs
BRIRs were simulated using the room acoustic simulator RAZR (version 0.962b) [26, 27]. Input parameters included the room geometry, wall absorption coefficients, source and receiver positions, a loudspeaker directivity database and HATS or individual HRTFs for different head-above-torso orientations. For more information on the HRTF measurement and the loudspeaker directivity data, see Stärz et al. [2].
To calculate BRIRs, RAZR uses a third-order Image Source Model (ISM) [28] in combination with a Feedback Delay Network (FDN) [29]. The actual room geometry was approximated as a shoebox shape. Wall absorption coefficients (one set per wall) in octave bands from 125 Hz to 16 kHz were used. These absorption coefficients were initially estimated from inspection of the walls. To refine the absorption model, monaural RIRs were measured and averaged over 25 source-receiver combinations. This allowed the room absorption coefficients in RAZR to be adjusted to match the frequency-dependent reverberation time of the average monaural RIR, in line with the approach taken in Blau et al. [15].
In total, two simulated BRIR sets were initially chosen for the current study. They differed in whether HATS or individual HRTFs were used and were accordingly labelled “sim:HATS” and “sim:Indiv”.
2.1.5 Artificially modified BRIRs
In addition to the initially simulated BRIR sets described above, we used three additional BRIR sets with artificial modifications. The purpose of these modifications was twofold: firstly, to see whether participants could consistently detect and rate the changes introduced, thereby validating the test method and secondly, to provide well-defined modifications that can support the interpretation of the ratings given by the participants.
The first modification, labelled “sim:Distance”, consisted of virtually moving the source two meters closer to the receiver, introducing an intended change in distance that is also expected to influence colouration and loudness. In the second modification, “sim:Wet”, the reverberation was increased by lowering the room absorption coefficients to 85% of their original value, leading to a 18% increase in reverberation time. This was expected to change the perception of reverberation primarily, but could also influence loudness, colouration and distance.
The final set, “anchor”, was designed to manipulate the perceived externalisation. To this end, a quasi-diotic BRIR set was created by duplicating the left ear signal for the right ear, thereby eliminating interaural level and time differences. To still enable gradual changes when the head is turned during playback, frequency-independent amplitude panning based on head orientation was applied, following methods described by Sengpiel [30] and already used as an anchor condition by Klein et al. [31] and Stärz et al. [2].
2.1.6 Headphone equalisation
The auralisations were reproduced via extra-aural headphones (AKG K1000, AKG Acoustics GmbH, Vienna, Austria), which were connected directly to the HMD by using an aluminium support that was explicitly designed for this purpose [32]. The headphones leave both ears free and are placed approximately 5 cm away from the participant’s ears. These headphones allow individual headphone equalisation without repositioning, minimising any audible effects caused by repositioning [33]. More specifically, the headphones’ impulse responses were measured immediately before the listening test. From these measurements, a headphone equalisation filter (HPEQ) was derived using regularised inversion [34]. The derived HPEQ was then applied to all pre-computed BRIRs. This procedure was performed immediately before the listening test to ensure that the headphones remained in the same position throughout the experiment.
2.1.7 Real time rendering
The real-time rendering block in Figure 1 illustrates the processing during the listening test. The visual room model was presented through the HMD using the Unreal Engine (v.4.27.2 (Digital Extremes, London, Ontario, Canada and Epic Games, Inc., Raleigh, NC, USA)), which handled the user interface, provided head-tracking data, and sent Open Sound Control (OSC) commands controlling the audio rendering. Headphone audio was generated using the time-variant overlap-add in partitions (TVOLAP) algorithm, as described by Jäger et al. [35, 36]. More specifically, the BRIR set corresponding to the current head-above-torso orientation angle was continuously selected in a nearest-neighbour sense with an update rate of 90 Hz and convolved with the chosen anechoic stimulus.
Latency in IVEs is critical and should be as low as possible to minimise user impact. Brungart et al. [37] found that headtracker latencies below a threshold of 60 ms were sufficiently fast for most applications using a virtual display. Meyer-Kahlen et al. [38] describe two latencies that are important when using audio-visual IVEs: firstly, the “motion-to-data-output” (movement to data transmission) and secondly, the “motion-to-sound” (movement to audio playback) latencies. Using their proposed method with an impulsive movement, a median “motion-to-data-output” latency of 17.56 ms (M = 18.24 ms, SD = 2.55 ms) and a median “motion-to-sound” latency of 38.88 ms (M = 37.01 ms, SD = 5.88 ms) was obtained, as already reported in Stärz et al. [2]. These latencies are well below the 60 ms target and should therefore be sufficient for the listening tests performed in this study.
2.1.8 Playback rooms
As mentioned above, we used two different playback rooms: a congruent room and a divergent room. The congruent room was the auralised room described in Section 2.1.1. The divergent room is a recording studio at Jade Hochschule in Oldenburg, Germany. It is smaller (7.37 m × 4.73 m × 3.2 m) than the congruent room and consists of a window front with open curtains, two plastered brick walls, a drywall, carpet on a concrete floor, an acoustically optimised ceiling and other acoustic treatments such as diffusors and Helmholz resonators. Its reverberation time is lower in comparison to the congruent room, as shown in Figure 2. This room was chosen since its reverberation resembles that of an office environment that could typically be used to perform evaluations of room acoustical attributes or in the context of the aforementioned applications of audio-visual virtual environments. A visual comparison of the playback rooms is given in Figure 3.
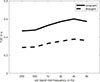 |
Figure 2. Frequency-dependent T20 values for congruent and divergent playback rooms in octave bands. |
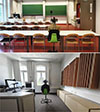 |
Figure 3. Rooms under investigation. Top: A HATS positioned at the listening position in the room under investigation, which is the congruent playback room in the experiment. Bottom: A HATS positioned in a recording studio, which is the divergent playback room in the experiment. During the experiments, the virtual room model shown in Figure 4 was presented through the HMD in both rooms. |
2.2 Audio-visual interactive virtual environment
The visual part of the audio-visual IVE was presented through an HMD (HTC VIVE Pro Eye, HTC Corporation, Xindian, New Taipei, Taiwan). The auralisation was reproduced via extra-aural headphones, as already described in Section 2.1.2 in the context of headphone equalisation.
Architecture students at Jade Hochschule Oldenburg designed the virtual room model of the congruent room, see Figure 4. For comparison, refer to the photograph of the physical room in the top picture of Figure 3. To interact with the IVE, a graphical user interface (GUI) was created containing sliders to rate the attributes, buttons to trigger play and pause, and additional buttons to reorder the sliders based on the currently selected values and to navigate through the listening test.
 |
Figure 4. The virtual model of the congruent room, displayed through an HMD during the listening test in the two playback rooms presented in Figure 3. |
2.3 Listening test
A total of 20 participants (4 female, 16 male, median age 27.5 years, ranging from 20 to 56 years, tested normal hearing) who had also participated in the previous study [2] took part in the listening test. These participants were considered to be expert listeners because they work or study in the field of hearing research, are familiar with listening tests and have experience with head-tracked binaural auralisations. A written introduction on how to control the GUI and how to interpret and rate the attributes was given to the participants. Before the listening test began, all participants subconsciously perceived the playback room. More specifically, they were not asked to actively explore the room thoroughly by walking around it or by examining its acoustics in detail. Instead, the introduction took place in the playback room itself, reflecting the casual and spontaneous way in which people typically perceive the visual and acoustical properties of a room in everyday life.
Written informed consent was obtained from all participants, and each participant was paid an hourly compensation of fourteen euros. The study was approved by the local ethics committee of the University of Oldenburg and adhered to the principles of the Declaration of Helsinki.
Using a multi-stimulus rating paradigm, participants blindly rated the seven different auralisation conditions (see Table 1) with respect to one perceptual attribute at a time. The perceptual attributes to be rated were partly taken from the Room Acoustical Quality Inventory (RAQI) [39], and included reverberance (dry – reverberant), tone colour (dark – bright), loudness (soft – loud), source distance (near – optimal – far), reproduction quality (low – high), plausibility (not plausible – plausible), and externalisation (internalised – externalised). The ratings were made on a scale from 0 to 100 in steps of ten, except for plausibility and externalisation, which were only rated at their poles. Participants were given a written introduction to the attributes. The source distance should be rated according to the visual representation. If the perceived source distance matches the visual presentation of the loudspeaker, it should be rated as optimal, i.e. a value of 50. If the source distance was closer to or further from the visually shown loudspeaker, participants should rate this accordingly. For reproduction quality, participants were asked to rate according to their personal preference.
Each auralisation condition was rated three times per attribute, over three blocks. Each of the three blocks started with reproduction quality. The other six attributes were randomised within each block. An interview was conducted after the experiment to collect the participants’ remarks regarding the experiment. This procedure was performed twice, once in the congruent playback room and once in the divergent playback room, across two separate days. The mean measurement duration in the congruent playback room was 24.02 min (SD: 9.20 min), and in the divergent playback room it was 23.14 min (SD: 7.39 min). Participants were allowed to take breaks whenever needed. To control for potential sequence effects, half of the participants began the experiment in the congruent playback room, while the other half started in the divergent playback room.
Participants could repeat the playback, switch between auralisations at will, and take an unlimited amount of time to rate the attribute in question. Also, they could rearrange the sliders to facilitate the comparison between auralisations, as described in Chevret and Parizet [40]. Participants were informed that they could rotate their heads within ±60° azimuth during the test.
The test began with a familiarisation phase in which participants were allowed to listen for at least 30 s per stimulus and to switch freely between the auralisations. In the familiarisation phase, three source signals were used for the auralisations: a female voice, a guitar and a saxophone. In contrast, a male speech stimulus [41] was used in the main test. This stimulus is a 118 s excerpt from the German poem “Froschkönig”. Participants were able to loop this excerpt to listen and rate for as long as they needed.
All source signals were normalised before auralisation, by using EBU R 128 [42] as implemented in the Matlab audio toolbox [43] to compensate for loudness differences between them. Note that this normalisation was applied to the anechoic source signals, i.e., the convolution with different BRIR sets could, in principle, give rise to loudness differences in the binaural stimuli.
2.4 Statistical analysis
For the statistical analysis of the data, the R software environment (v 4.6.2) [44] with the additional packages tidyverse (v 2.0.0) [45], stringi (v 1.8.4) [46], ez (v 4.4-0) [47], emmeans (v 2.0.1) [48], ARTool (v 0.11.2) [49], afex (v 1.5-1) [50] and BayesFactor (v 0.9.12-4.7) [51] was used.
As Mendonça and Delikaris-Manias [52] stated, the assumption of independence of observations is violated for a MUSHRA test scenario. Therefore, they suggest not using ANOVA tests but instead non-parametric tests such as Friedman or Wilcoxon. Since the Friedman test is limited to one-factor designs, we instead employed an Aligned Rank Transform (ART) ANOVA [53], which enables the analysis of both main and interaction effects. When significant main effects or interactions were detected, we performed post hoc comparisons using the emmeans procedure applied to the corresponding aligned linear models, with p-values adjusted using the Holm method.
For the attributes externalisation and plausibility, which contained categorical data, generalised linear models [54] of the binomial family were computed.
As we hypothesise that the experimental room has no effect, we need to test for equivalence. This involves assessing whether the underlying rating distributions of the room acoustic attributes for each auralisation method are equal, regardless of the room. To this end, a Bayes factor was calculated for the alternative hypothesis. As an indicator of equivalence, this factor must be inverted to obtain the Bayes factor for the null hypothesis [55]. To interpret the inverted Bayes factor, a threshold of greater than 3 is set for evidence of equivalence [56].
3 Results
Results of the multi-stimulus rating experiment are shown in Figure 5. For each auralisation method, the ratings obtained in the congruent room are represented by the lightly coloured box plots on the left. In contrast, chequered box plots on the right represent the corresponding ratings obtained in the divergent room. It can be seen that the median values are very similar for both playback rooms, independent of the room-acoustic attribute as well as the BRIR sets. Their medians differ by less than one step in the rating score.
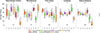 |
Figure 5. Box plots illustrating the average ratings from repeated measurements as a function of BRIR sets for each evaluated room-acoustic attribute. Each pair of box plots in the same colour represents the ratings for both rooms, with the left, unfilled box plot always representing the congruent playback room and the chequered box plot representing the divergent playback room. |
The ART ANOVA revealed a significant main effect of BRIR set for all attributes: reproduction quality (F(6, 247) = 70.79, p < 0.001,  ), reverberance (F(6, 247) = 82.71, p < 0.001,
  ), tone colour (F(6, 247) = 19.56, p < 0.001,
  ), loudness (F(6, 247) = 81.60, p < 0.001,
  ) and source distance (F(6, 247) = 72.65, p < 0.001,
  ). A significant main effect of the factor room was found only for source distance (F(1, 247) = 5.69, p < 0.018,
  ), indicating a small effect size. No significant interaction effect between room and BRIR set was observed for any attribute. To further validate the robustness of our findings, we conducted a repeated-measures ANOVA (rmANOVA), which produced the same pattern of significant effects.
The overall goal of using different auralisations in this study is to determine whether the room effect generalises across auralisation methods, which would be reflected in an interaction effect between the factors room and BRIR set. However, no such interaction effect was found, as also visualised in Figure 5. Since the research question concerns the influence of the playback room, we do not further analyse differences between the BRIR sets here. This analysis was conducted in a previous study, in which a comparison with the real room acoustics was also made [2]. That study provides a broader comparison of different auralisations and their performance with respect to the real room acoustics.
Because we partly used the same auralisations with the same participants, we would expect similar ratings for the congruent condition, although one must note that the experimental design in Stärz et al. [2] included additional auralisations and a real reference and hence, absolute values might deviate. Nevertheless, when comparing the ratings of the congruent playback room to those from Stärz et al. [2], the same tendencies across the different BRIR sets can be found.
To further analyse the effect of the playback room, Figure 6 presents average ratings across BRIR sets for each attribute. This visualises the typical procedure when examining main effects. The distributions of these averaged ratings are very similar between the congruent room and the divergent room. Nevertheless, the ART ANOVA post-hoc test indicated a significant difference between the playback rooms for one attribute, namely source distance (t[247] = − 2.39, p = 0.017,  ). Source distance was rated as being farther away in the divergent room. However, the median difference of two steps, compared with an artificially modified source presented 2 m closer to the listener with 17 steps, was relatively small.
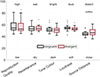 |
Figure 6. Box plots illustrating the ratings averaged over three repetitions for each room-acoustic attribute. Each box plot represents ratings from all participants (N = 20) across all BRIR sets (7 conditions) for the given attribute. Within each attribute, the left black box plot corresponds to the congruent playback room, and the right red box plot corresponds to the divergent playback room. |
Results for externalisation and plausibility are shown in Figure 7. We found a significant main effect of the BRIR set. However, there was no significant main effect related to the playback room.
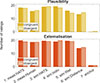 |
Figure 7. Plausibility and externalisation ratings as a function of BRIR sets. Each pair of bar plots represents the ratings for both rooms, with the left, unfilled bar always representing the congruent playback room and the striped bar representing the divergent playback room. |
Since we hypothesised that the playback room does not influence room acoustic ratings or plausibility and externalisation, we performed tests for equivalence. The resulting Bayes factor for the alternative hypothesis and the inverted Bayes factors for the null hypothesis are shown in Table 2. It can be seen that the Bayes factor for the null hypothesis exceeds the threshold of three for all attributes except source distance, indicating that for most attributes, the ratings are equivalent regardless of the playback room in which they were obtained.
Test for equivalence of congruent or divergent presentation room.
4 Discussion
In this study, we conducted a multi-stimulus rating experiment in which participants evaluated room acoustic attributes within both a congruent and a divergent room. The aim was to investigate the influence of the playback room on head-tracked binaural auralisations while using an audiovisual IVE.
4.1 Valid rating of room acoustical attributes in IVEs: reducing the impact of the playback room
This study provides evidence that plausible and externalised head-tracked binaural audio is robust against the influence of the playback room if a congruent visualisation is presented via HMD. This suggests that, for a range of applications such as the location-independent assessment of simulated room acoustics, the creation of real-life scenes for psychological research, or the treatment of anxiety disorders, the playback room is of minor importance as long as the visual and auditory virtual scenes are convincing and match. Higher levels of presence in VR can be expected when a system is inclusive, meaning that no or only little interference from external reality occurs [57]. Presence, in turn, increases the effectiveness of training tools and anxiety disorder treatments such as exposure therapy in VR [58].
It is important to consider that the divergent room was less reverberant than the auralised room. Brandenburg et al. [17] discussed that presenting auralisations of a dry room in a playback room with higher reverberation results in a particularly strong room divergence effect. This was demonstrated by Gil-Carvajal et al. [20], comparing rooms with different reverberation levels. They found that in a divergent playback room with higher reverberation, distance perception was impaired. However, this was not the case in the anechoic condition. They partially explained this by highlighting that the difference in reverberation between the congruent room and the increased reverberation condition was higher than the difference between the congruent room and the anechoic room.
Consequently, based on the underlying study, it is not possible to make statements about increased reverberation in the playback room based on our findings. However, we decided to use lower reverberation in the playback room as a more practical condition. In the context of listening to a room before construction, the acoustic engineer would typically be in an office environment, which is likely smaller and less reverberant than most of the rooms they design. When using IVEs in a lab condition, it is also expected that experiments will take place in small rooms or even in a hearing booth designed to have low reverberation. As it is not known based on the underlying study, care should now be taken to ensure that the playback room has a lower reverberation time than the auralised room. Further investigation into the condition when a dryer auralised room is reproduced in a more reverberant playback room is necessary.
4.2 Preserving externalisation in IVEs
Externalisation is known to be affected by the RDE [18] and thus requires separate consideration. In our study, high externalisation scores were consistently observed for most BRIR sets, regardless of the playback room. Even when the source distance was artificially reduced, the majority of participants continued to perceive the sound as externalised, though with slightly lower scores.
Lavandier et al. [59] demonstrated that, although externalisation and distance perception are correlated, they may not represent different points along a single perceptual continuum. Concerning our results, this means that, even when a source is perceived as closer–as a result of artificial manipulation or a divergent playback room–externalisation can remain high.
Given that we observed consistently high externalisation scores regardless of the playback room, we conclude that audio-visual IVEs can effectively avoid the RDE, thereby reducing or even eliminating its adverse effects on externalisation. These findings are consistent with previous research in which the playback room was acoustically and visually congruent with the virtual environment used in the experiment [2]. In that study, various auralisation methods were compared, and an HMD was used to present congruent visuals. Care was taken to minimise the presence of the RDE, which could only arise if there were discrepancies between the simulated visual room model and the playback room, which was not the case.
Li et al. [60] also showed that externalised auralisations are possible when visualisations are presented in VR. They compared externalisation ratings of BRIRs from different rooms in a real listening environment and found that the RDE negatively impacts externalisation. However, while using the same BRIRs with matching visualisation via HMD, high externalisation scores were also found for divergent rooms. They stated that BRIRs need to match the listener’s expectations when no acoustic cues from the congruent room are available.
These findings highlight the potential of audio-visual IVEs to create compelling and perceptually accurate virtual acoustic environments that are unaffected by the physical characteristics of the playback room. This suggests that using audio-visual IVEs does not result in any detrimental RDE on externalisation.
4.3 Perceived source distance
Perceived distance was found to depend on the playback room, with the real source being judged as farther away when the experiment was conducted in the divergent room than in the congruent room. Although these differences are significant, the median differences between the ratings in the congruent and divergent rooms are small and, in practice, may be negligible. The BRIR set with a manipulated source distance was rated about 20 steps closer than the visual loudspeaker in the congruent room and 17 steps closer in the divergent room. A coarse estimate of the corresponding distance error that occurs would be one-sixth of the two-meter distance modification that was applied, corresponding to about 33 cm distance error.
An effect of perceived distance in a divergent playback room was also observed by Lombera et al. [61], comparing individual and non-individualised BRIRs in either a congruent or divergent room with decreased reverberation time to test for distance perception. They reported comparable performance in the congruent condition. However, in the divergent condition, most participants experienced a more compressed perception of distance.
This was also shown by Gil-Carvajal et al. [20]. While comparing the auditory or visual effect of a divergent playback room, they found that the mismatch between the recording room and the playback room leads to an altered externalisation concerning the perceived distance. They tested the visual and auditory appearance of the rooms separately. Interestingly, the visual appearance did not affect distance perception, whereas the acoustic appearance of the room did influence the perceived source distance, which was perceived as closer.
They additionally compared different room types, a large anechoic room, as well as a small reverberant room. Upon entry into the room, a noise burst was emitted via loudspeakers every five seconds, allowing participants to perceive the room acoustics in a reproducible manner. Only the reverberant small room had a significant effect on distance judgments if the noise bursts introduced auditory room cues. If only visual room cues were available, the distance judgments were unaffected. The authors attributed this to the higher difference in reverberation time compared to the auralised room. They stated that no effect was found for the anechoic room, as no conflicting room information could be perceived upon entry into the room. However, it remains unknown whether a real room with a lower reverberation time also negatively influences the perceived distance.
In the present study, we observed a small but significant difference in perceived distance in the playback room with the lower reverberation time. In contrast to Gil-Carvajal et al. [20], who used a noise burst to explicitly evoke the perception of auditory cues in their experiment, we did not play a noise burst as participants entered the room, but participants heard at least the voice of the experimenter. The absence of a noise burst in our experiments might have reduced the auditory effect of the playback room. We chose not to explicitly provide auditory information about the presentation room because we expect that, in typical application scenarios such as office environments or rehearsal rooms, the playback rooms would be perceived more subconsciously and thus would not provide such explicit information.
Despite the differences in perceived source distance, the externalisation ratings appear to be similar across rooms. This suggests that there is no evidence of externalisation changing due to the RDE. In other words, whilst the perceived source distance may be influenced by the playback room, the sense of the sound source being external to the listener’s head remains intact.
5 Conclusion and outlook
The independence of audio-visual IVEs from the playback room in which they are used is a fundamental prerequisite for their use in location-independent assessment of simulated room acoustics. In this study, we investigated whether a virtually rendered room presented via HMD and headphones is affected by the playback room in which the presentation takes place. Specifically, we conducted a multi-stimulus rating in two playback rooms. One room was congruent with the virtually rendered room, while the other was smaller and less reverberant. With this design, we aimed for a practical application scenario, because the divergent playback room resembles a typical office-like environment.
We found no effect of the playback room on the ratings of a wide variety of room-acoustical attributes, even when participants were familiar with the playback room and had experienced it audio-visually immediately before the listening test. These results suggest that participants can adapt to the audio-visual presentation rapidly enough to overcome any previous exposure to the playback room. This indicates that the audio-visual illusion created by the IVE is strong enough to override the influence of the playback room, at least when the divergent room is less reverberant and smaller.
Furthermore, the current study demonstrates that an audio-visual IVE with a highly plausible, congruent rendering of audio and video can be employed to assess room-acoustical attributes with a high degree of validity under the specific conditions tested, as shown for the case where the divergent room has a reasonably short reverberation time. Under these circumstances, the RDE does not degrade the perceived externalisation of auralisations. While the playback room may influence source-distance judgments, the differences are small and may be considered negligible.
These findings contribute to our understanding of how the playback room influences specific aspects of auditory perception, such as source distance, while leaving others, such as reverberance, tone colour, loudness, externalisation, and plausibility, relatively unaffected.
Subsequent studies could examine rooms with different reverberation times and explore different source distances and positions, since the present study focused on a single distance, position, and room. It would also be interesting to investigate whether the effect of increased source distance remains consistent when the divergent playback room is larger than the auralised room. Additionally, non-speech stimuli such as music or noise could be examined, which may require the evaluation of additional room-acoustic attributes.
Acknowledgments
We thank our participants for taking part in the study.
Funding
This work was funded by the German Research Foundation (Deutsche Forschungsgemeinschaft, DFG) under the project ID 422686707, SPP2236 – AUDICTIVE, subproject 444832396. Parts of this study have been presented at the 51st Annual Meeting on Acoustics DAS/DAGA 2025.
Conflict of interest
The authors declare no conflict of interest.
Data availability statement
The raw rating data and interview transcripts associated with this article are available in Zenodo, under the reference [62].
References
- F. Brinkmann, A. Lindau, S. Weinzierl: On the authenticity of individual dynamic binaural synthesis. Journal of the Acoustical Society of America 142, 4 (2017) 1784–1795. [Google Scholar]
- F. Stärz, S.V.D. Par, S. Roßkopf, L.O.H. Kroczek, A. Mühlberger, M. Blau: Comparison of binaural auralisations to a real loudspeaker in an audiovisual virtual classroom scenario: effect of room acoustic simulation, HRTF dataset, and head-mounted display on room acoustic perception. Acta Acustica 9 (2025) 31. [Google Scholar]
- J. Blauert, J. Braasch, Eds.: The Technology of Binaural Understanding (Modern Acoustics and Signal Processing). Springer International Publishing, Cham, 2020. [Google Scholar]
- N. Meyer-Kahlen: Transfer-Plausible Acoustics for Augmented Reality. Aalto University, Helsinki, 2024. [Google Scholar]
- C. Kuhn-Rahloff: Realitätstreue, Natürlichkeit, Plausibilität. Springer, Berlin, Heidelberg, 2012. [Google Scholar]
- C. Schneiderwind, M. Richter, N. Merten, A. Neidhardt: Effects of modified late reverberation on audio-visual plausibility and externalization in AR, in: 2023 Immersive and 3D Audio: from Architecture to Automotive (I3DA), 2023, pp. 1–9. [Google Scholar]
- M. Gospodarek, O. Warusfel, P. Ripollés, A. Roginska: Methodology for perceptual evaluation of plausibility with self-translation of the listener, in: Proceedings of the AES International Conference on Audio for Virtual and Augmented Reality (AVAR), 2022, pp. 401–410. [Google Scholar]
- A. Neidhardt, A. Tommy, A.D. Pereppadan: Plausibility of an interactive approaching motion towards a virtual sound source based on simplified BRIR sets, in: 144th AES Convention. AES, Milan, 2018. [Google Scholar]
- A. Lindau, S. Weinzierl: Assessing the plausibility of virtual acoustic environments. Acta Acustica United with Acustica 98, 5 (2012) 804–810. [Google Scholar]
- D.M. Green, J.A. Swets: Signal Detection Theory and Psychophysics. Robert E. Krieger, Oxford, England, 1974, 479 pp. [Google Scholar]
- F. Stärz, L.O.H. Kroczek, S. Roßkopf, A. Mühlberger, S. van de Par, M. Blau: Perceptual comparison between the real and the auralized room when being presented with congruent visual stimuli via a head-mounted display, in: Proceedings of the International Congress on Acoustics (ICA), Gyeongju, 2022. [Google Scholar]
- A. Neidhardt, C. Schneiderwind, F. Klein: Perceptual matching of room acoustics for auditory augmented reality in small rooms - Literature review and theoretical framework. Trends in Hearing 26 (2022). [Google Scholar]
- C. Pike, F. Melchior, T. Tew: Assessing the plausibility of non-individualised dynamic binaural synthesis in a small room, in: 55th International AES Conference, 2014. [Google Scholar]
- G. Keidser, G. Naylor, D.S. Brungart, et al.: The quest for ecological validity in hearing science: what it is, why it matters, and how to advance it. Ear and Hearing 41, Suppl 1 (2020) 5S–19S. [CrossRef] [PubMed] [Google Scholar]
- M. Blau, A. Budnik, M. Fallahi, H. Steffens, S.D. Ewert, S. van de Par: Toward realistic binaural auralizations - Perceptual comparison between measurement and simulation-based auralizations and the real room for a classroom scenario. Acta Acustica 5 (2021) 8. [CrossRef] [EDP Sciences] [Google Scholar]
- V. Best, R. Baumgartner, M. Lavandier, P. Majdak, N. Kopčo: Sound externalization: a review of recent research. Trends in Hearing 24 (2020). [Google Scholar]
- K. Brandenburg, F. Klein, A. Neidhardt, U. Sloma, S. Werner: Creating auditory illusions with binaural technology, in: J. Blauert, J. Braasch, Eds. The Technology of Binaural Understanding. Springer International Publishing, Cham, 2020, pp. 623–663. [Google Scholar]
- K. Brandenburg, S. Werner, F. Klein, C. Sladeczek: Auditory illusion through headphones: history, challenges and new solutions, in: Proceedings of the Meetings on Acoustics. Vol. 28. Buenos Aires, 2016. [Google Scholar]
- J. Udesen, T. Piechowiak, F. Gran: The effect of vision on psychoacoustic testing with headphone-based virtual sound. Journal of the Audio Engineering Society 63, 7/8 (2015) 552–561. [Google Scholar]
- J.C. Gil-Carvajal, J. Cubick, S. Santurette, T. Dau: Spatial hearing with incongruent visual or auditory room cues. Scientific Reports 6, 1 (2016) 37342. [PubMed] [Google Scholar]
- R. Keen, R.L. Freyman: Release and re-buildup of listeners’ models of auditory space. Journal of the Acoustical Society of America 125, 5 (2009) 3243–3252. [Google Scholar]
- F. Stärz, L.O.H. Kroczek, S. Roßkopf, A. Mühlberger, S. Van De Par, M. Blau: Comparing room acoustical ratings in an interactive virtual environment to those in the real room, in: Proceedings of the Forum Acusticum, Torino, Italy, 2023. [Google Scholar]
- S. Werner, F. Klein, T. Mayenfels, K. Brandenburg: A summary on acoustic room divergence and its effect on externalization of auditory events, in: 8th International Conference on Quality of Multimedia Experience (QoMEX). IEEE, Lisbon, Portugal, 2016. DOI: https://doi.org/10.1109/QoMEX.2016.7498973. [Google Scholar]
- F. Denk, F. Brinkmann, A. Stirnemann, B. Kollmeier: The PIRATE: an anthropometric earPlug with exchangeable microphones for individual reliable acquisition of transfer functions at the ear canal entrance, in: Fortschritte Der Akustik (DAGA), Rostock, 2019. [Google Scholar]
- HTC-Corporation: VIVE Pro Eye Specs & User Guide - Developer Resources, 2025. [Online]. Available: https://developer.vive.com/resources/hardware-guides/vive-pro-eye-specs-user-guide/ (visited on 10/30/2025). [Google Scholar]
- T. Wendt, S. Van De Par, S.D. Ewert: A computationally-efficient and perceptually-plausible algorithm for binaural room impulse response simulation. Journal of the Audio Engineering Society 62, 11 (2014) 748–766. [CrossRef] [Google Scholar]
- H. Steffens, S. van de Par, S. Ewert: Perceptual relevance of speaker directivity modelling in virtual rooms, in: Proceedings of the 23rd International Congress on Acoustics, Aachen, 2019, pp. 2651–2658. [Google Scholar]
- J.B. Allen, D.A. Berkley: Image method for efficiently simulating small-room acoustics. Journal of the Acoustical Society of America 65, 4 (1979) 943–950. [Google Scholar]
- J.-M. Jot, A. Chaigne: Digital delay networks for designing artificial reverberators, in: 90th AES Convention, 1991. [Google Scholar]
- E. Sengpiel: Gleichungen für die Pegeldifferenz- und Laufzeitdifferenz-Lokalisationskurve, 1995. [Online]. Available: https://sengpielaudio.com/GleichungenDLundDt.pdf (visited on 05/15/2024). [Google Scholar]
- F. Klein, S. Werner, T. Mayenfels: Influences of training on externalization of binaural synthesis in situations of room divergence. Journal of the Audio Engineering Society 65, 3 (2017) 178–187. [CrossRef] [Google Scholar]
- F. Stärz, S. Roßkopf, A. Mühlberger, L. Kroczek, S. Par, M. Blau: Acoustically transparent headphones as an add-on for a head-mounted display, in: Fortschritte Der Akustik (DAGA), Hannover, 2024. [Google Scholar]
- M. Paquier, V. Koehl: Audibility of headphone positioning variability, in: 128th Audio Engineering Society Convention. Audio Engineering Society, London (UK), 2010. [Google Scholar]
- O. Kirkeby, P. Nelson: Digital filter design for inversion problems in sound reproduction. Journal of the Audio Engineering Society 47 (1999) 583–595. [Google Scholar]
- H. Jaeger, J. Bitzer, U. Simmer, M. Blau: Echtzeitfähiges Binaurales Rendering mit Bewegungssensoren von 3D-Brillen, in: Fortschritte der Akustik (DAGA), Kiel, 2017. [Google Scholar]
- H. Jaeger, U. Simmer, J. Bitzer, M. Blau: Time-variant overlap-add in partitions, 2023. [Online]. Available: http://arxiv.org/abs/2310.00319, pre-published. [Google Scholar]
- D.S. Brungart, A.J. Kordik, B.D. Simpson: Effects of headtracker latency in virtual audio displays. Journal of the Audio Engineering Society 54, 1 (2006) 32–44. [Google Scholar]
- N. Meyer-Kahlen, M. Kastemaa, S.J. Schlecht, T. Lokki: Measuring motion-to-sound latency in virtual acoustic rendering systems. Journal of the Audio Engineering Society 71, 6 (2023) 390–398. [CrossRef] [Google Scholar]
- S. Weinzierl, S. Lepa, D. Ackermann: A measuring instrument for the auditory perception of rooms: the room acoustical quality inventory (RAQI). Journal of the Acoustical Society of America 144, 3 (2018) 1245–1257. [CrossRef] [PubMed] [Google Scholar]
- P. Chevret, E. Parizet: An efficient alternative to the paired comparison method for the subjective evaluation of a large set of sounds, in: Proceedings of the International Congress on Acoustics (ICA), Madrid (Spain), 2007. [Google Scholar]
- D. Leckschat, C. Epe: Aufnahmen von Sprecherinnen und Sprechern zur Verwendung in der Virtuellen Akustik, Zenodo, 2020. DOI: https://doi.org/10.5281/zenodo.3601086. [Google Scholar]
- EBU: EBU R 128 loudness normalisation and permitted maximum level of audio signals, 2011. [Online]. Available: https://tech.ebu.ch/docs/r/r128_2011_DE.pdf (visited on 05/15/2023). [Google Scholar]
- MathWorks: Audio Toolbox User’s Guide, 2022, p. 1186. [Google Scholar]
- R Core Team: R: a language and environment for statistical computing, version 4.6.2. R Foundation for Statistical Computing, Vienna, Austria, 2024. [Online]. Available: http://www.R-project.org/. [Google Scholar]
- H. Wickham, M. Averick, J. Bryan, et al.: Welcome to the Tidyverse. Journal of Open Source Software 4, 43 (2019) 1686. [CrossRef] [Google Scholar]
- M. Gagolewski: Stringi: fast and portable character string processing in R. Journal of Statistical Software 103, 2 (2022) 1–59. [Google Scholar]
- M.A. Lawrence: Ez: easy analysis and visualization of factorial experiments, version R package 4.4-0, 2016. [Online]. Available: https://cran.r-project.org/web/packages/ez/index.html (visited on 04/11/2025). [Google Scholar]
- R.V. Lenth, J. Piaskowski: Emmeans: estimated marginal means, aka least-squares means, manual, 2025. [Online]. Available: https://rvlenth.github.io/emmeans/. [Google Scholar]
- M. Kay, L.A. Elkin, J.J.H. Jacob, O. Wobbrock: ARTool: aligned rank transform for nonparametric factorial anovas, manual, 2025. DOI: https://doi.org/10.5281/zenodo.594511. [Online]. Available: https://github.com/mjskay/ARTool. [Google Scholar]
- H. Singmann, B. Bolker, J. Westfall, F. Aust: Afex: analysis of factorial experiments, manual, 2016. [Online]. Available: https://CRAN.R-project.org/package=afex. [Google Scholar]
- R.D. Morey, J.N. Rouder: BayesFactor: computation of Bayes factors for common designs, version 0.9.12-4.7, 2023. [Online]. Available: https://github.com/richarddmorey/bayesfactor (visited on 04/11/2025). [Google Scholar]
- C. Mendonça, S. Delikaris-Manias: Statistical tests with MUSHRA data, in: 144th AES Convention. Audio Engineering Society, Milan (Italy), 2018. [Google Scholar]
- J.O. Wobbrock, L. Findlater, D. Gergle, J.J. Higgins: The aligned rank transform for nonparametric factorial analyses using only anova procedures, in: Proceedings of the SIGCHI Conference on Human Factors in Computing Systems. ACM, Vancouver, BC Canada, 2011, pp. 143–146. [Google Scholar]
- P. McCullagh, J. Nelder: Generalized Linear Models, 2nd edn. Monographs on Statistics and Applied Probability. Vol. 37. Chapman and Hall, London, 1989. [Google Scholar]
- C. Keysers, V. Gazzola, E.-J. Wagenmakers: Using Bayes factor hypothesis testing in neuroscience to establish evidence of absence. Nature Neuroscience 23, 7 (2020) 788–799. [Google Scholar]
- E.-J. Wagenmakers: A practical solution to the pervasive problems of p values. Psychonomic Bulletin & Review 14, 5 (2007) 779–804. [CrossRef] [PubMed] [Google Scholar]
- M. Slater, S. Wilbur: A framework for immersive virtual environments (FIVE): speculations on the role of presence in virtual environments. Presence: Teleoperators and Virtual Environments 6, 6 (1997) 603–616. [CrossRef] [Google Scholar]
- A. Wiebe, K. Kannen, B. Selaskowski, et al.: Virtual reality in the diagnostic and therapy for mental disorders: a systematic review. Clinical Psychology Review 98 (2022) 102213. [Google Scholar]
- M. Lavandier, L. Heine, F. Perrin: Comparing the auditory distance and externalization of virtual sound sources simulated using nonindividualized stimuli. Trends in Hearing 28 (2024). [Google Scholar]
- S. Li, R. Schlieper, A. Tobbala, J. Peissig: The influence of binaural room impulse responses on externalization in virtual reality scenarios. Applied Sciences 11, 21 (2021) 10198. [Google Scholar]
- E.N. Lombera, J. Cerviño, L.B. Piceda, M. Viskovic, R.O. Vergara: Comparison of perceived auditory distance between real and virtual sound sources. Applied Acoustics 231 (2025) 110519. [Google Scholar]
- F. Stärz, S. van de Par, S. Roßkopf, L. Kroczek, A. Mühlberger, M. Blau: Supplementary material - Use of audio-visual interactive virtual environments to resolve the room divergence effect, Zenodo, 2025. DOI: https://doi.org/10.5281/zenodo.17515167. [Google Scholar]
Cite this article as: Starz F. van de Par S. Roßkopf S. Kroczek L.O.H. Müuhlberger A. & Blau M. 2026. Use of audiovisual interactive virtual environments to avoid the room divergence effect in office-like environments. Acta Acustica, 10, 29. https://doi.org/10.1051/aacus/2026024.
All Tables
All Figures
|
Figure 1. A block diagram, adapted from Stärz et al. [2], presenting an overview of the steps involved in generating the head-tracked binaural auralisations. |
| In the text | |
|
Figure 2. Frequency-dependent T20 values for congruent and divergent playback rooms in octave bands. |
| In the text | |
|
Figure 3. Rooms under investigation. Top: A HATS positioned at the listening position in the room under investigation, which is the congruent playback room in the experiment. Bottom: A HATS positioned in a recording studio, which is the divergent playback room in the experiment. During the experiments, the virtual room model shown in Figure 4 was presented through the HMD in both rooms. |
| In the text | |
|
Figure 4. The virtual model of the congruent room, displayed through an HMD during the listening test in the two playback rooms presented in Figure 3. |
| In the text | |
|
Figure 5. Box plots illustrating the average ratings from repeated measurements as a function of BRIR sets for each evaluated room-acoustic attribute. Each pair of box plots in the same colour represents the ratings for both rooms, with the left, unfilled box plot always representing the congruent playback room and the chequered box plot representing the divergent playback room. |
| In the text | |
|
Figure 6. Box plots illustrating the ratings averaged over three repetitions for each room-acoustic attribute. Each box plot represents ratings from all participants (N = 20) across all BRIR sets (7 conditions) for the given attribute. Within each attribute, the left black box plot corresponds to the congruent playback room, and the right red box plot corresponds to the divergent playback room. |
| In the text | |
|
Figure 7. Plausibility and externalisation ratings as a function of BRIR sets. Each pair of bar plots represents the ratings for both rooms, with the left, unfilled bar always representing the congruent playback room and the striped bar representing the divergent playback room. |
| In the text | |
Current usage metrics show cumulative count of Article Views (full-text article views including HTML views, PDF and ePub downloads, according to the available data) and Abstracts Views on Vision4Press platform.
Data correspond to usage on the plateform after 2015. The current usage metrics is available 48-96 hours after online publication and is updated daily on week days.
Initial download of the metrics may take a while.