Figure 2
Download original image
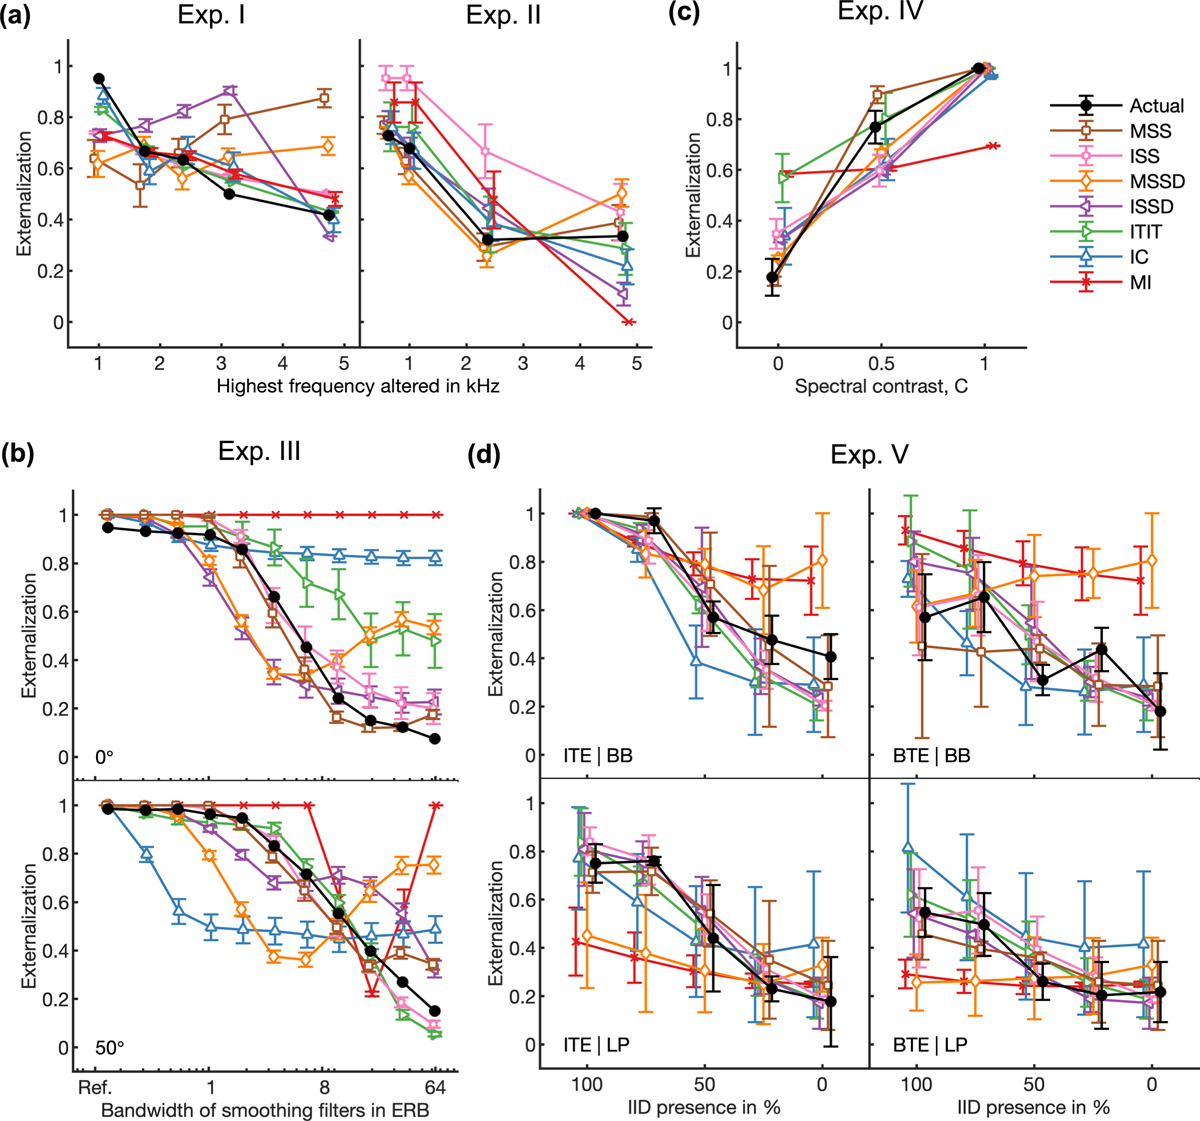
Externalization ratings: actual data from psychoacoustic experiments (closed circles) and simulations of the single-cue models (open symbols). (a) Effects of low-frequency modifications tested by Hartmann and Wittenberg [33]. Exp. I: IID set to zero (bilateral average magnitude); actual data from their Figure 7, average from N = 2. Exp. II: ipsilateral magnitudes flattened (IID compensated by contralateral magnitudes); actual data from their Figure 8, average from N = 4. Simulated results for various cues, average from N = 21. (b) Exp. III: effect of spectral smoothing of low-frequency sounds presented from various azimuths (left: 0°; right: 50°); actual data represents direct-sound condition from Hassager et al. [17], average from N = 7. Simulated N = 21. (c) Exp. IV: effect of spectral smoothing in high frequencies as a function of spectral contrast (C = 1: natural listener-specific spectral profile; C = 0: flat spectra); actual data calculated from the paired-comparison data from Baumgartner et al. [34], N = 10 (actual and simulated). (d) Exp. V: effects of stimulus bandwidth and microphone casing for various mixes between simulations based on listener-specific BRIRs (100%) and time-delay stereophony (0%); actual data from Boyd et al. [35], N = 3 (actual and simulated). ITE: in-the-ear casing; BTE: behind-the-ear casing; BB: broadband stimulus; LP: low-pass filtered at 6.5 kHz; Error bars denote standard errors of the mean.
Current usage metrics show cumulative count of Article Views (full-text article views including HTML views, PDF and ePub downloads, according to the available data) and Abstracts Views on Vision4Press platform.
Data correspond to usage on the plateform after 2015. The current usage metrics is available 48-96 hours after online publication and is updated daily on week days.
Initial download of the metrics may take a while.