| Issue |
Acta Acust.
Volume 5, 2021
|
|
|---|---|---|
| Article Number | 58 | |
| Number of page(s) | 14 | |
| Section | Hearing, Audiology and Psychoacoustics | |
| DOI | https://doi.org/10.1051/aacus/2021051 | |
| Published online | 24 December 2021 | |
Scientific Article
Cross-site investigation on head-related and headphone transfer functions: variabilities in relation to loudness balancing
1
Institute for Hearing Technology and Acoustics, RWTH Aachen University, 52056 Aachen, Germany
2
Medizinische Physik & Cluster of Excellence Hearing4All, Universität Oldenburg, 26111 Oldenburg, Germany
3
Now at: German Institute of Hearing Aids, Anschützsraϐe 1, 23562 Lübeck, Germany
* Corresponding author: This email address is being protected from spambots. You need JavaScript enabled to view it.
Received:
4
June
2021
Accepted:
27
November
2021
Abstract
Headphone transfer function (HpTF) and head-related transfer function (HRTF) measurements are crucial in acoustic science and in binaural virtual acoustic applications. Yet, their measurement set-up, procedure or post-processing is different for nearly every lab, especially for the HRTF measurements. To compare findings between different labs, these measurement deviations have to be quantified alongside with their influence on perceptual aspects. In the scope of a cross-site investigation on loudness balancing between headphone and loudspeaker listening, a set of HpTFs with three different headphones (open, closed, insert earphones) and HRTF close to the eardrum were measured in 14 participants travelling to two different measurement sites at Aachen and Oldenburg. Though set-ups for measuring the HRTF are very different between sites, the gathered HRTFs are quite consistent across them. For the measured HpTFs, across sites the open headphones consistently yield a slightly lower variability in the range from 70 to 5000 Hz than the closed one while the insert earphones exhibit much higher variabilities and a limited range of reproducible results. The difference in loudness balancing across labs could well be predicted by site-specific systematic differences in HpTFs with the exception of 1 kHz narrowband stimulus. This clearly indicates the limits in comparability of HpTFs and loudness balancing across labs and the importance of using headphones with high repeatability like the open ones used in this investigation.
Key words: HpTF / HRTF / Loudness mismatch
© M. Kohnen et al., Published by EDP Sciences, 2021
 This is an Open Access article distributed under the terms of the Creative Commons Attribution License (https://creativecommons.org/licenses/by/4.0), which permits unrestricted use, distribution, and reproduction in any medium, provided the original work is properly cited.
1 Introduction
With the advent of three-dimensional video capturing and consumer products for playback such as head-mounted displays, correct spatial audio presentation is desired for immersive experiences. Binaural playback over headphones is the most economic, easiest to set-up and most flexible solution and therefore typically used these days. To increase the authenticity of these methods, individual head-related transfer functions (HRTFs) are usually considered ideal for binaural synthesis with playback over headphones compensated by individual headphone transfer functions (HpTF) [1]. Rather complex multi-loudspeaker set-ups and methods for performing HRTF measurements have been implemented at multiple research labs (see [2] for an overview). However, no ubiquitous method to conduct these measurements has been established and no efforts are made to establish a unified standard at the moment. On the contrary, HpTFs are directly measured on ear simulators or humans, but they underlie a certain dependency on fitting of the headphone to the head which changes with every taking-off and putting-on (repositioning) of the headphones [3–6]. In addition, both HRTFs and HpTFs depend on the recording location in the ear, thus increasing the likelihood that the resulting functions critically depend on the exact procedure pursued in each laboratory and with each individual subject. The aim of the current study therefore is to estimate the expected variation across laboratories in relation to the variability across subjects, and to evaluate these variations by their respective consequences regarding the estimated level at eardrum in a loudness balancing experiment.
Hence, in a cross-site comparison between the lab sites in Aachen and Oldenburg, a dataset of HRTFs and HpTFs for three different headphones were measured with probe microphones close to the eardrum in 14 participants travelling to both measurement sites. Even though these probe tube measurements are more time consuming than blocked-entrance measurements, we employed this method since any kind of ear canal entrance measurement would not be applicable for insert earphones that were included in the study, as well as to correctly capture effects of acoustic loading of the ear by headphones [5, 7]. Additionally, the probe tube placement close to the eardrum is an anatomically well-defined location, as opposed to insertion at the blocked ear canal entrance.
Literature on reproducibility measurements of individual HRTFs is limited. The potential influence of the lab has been highlighted, e.g., by comparison of HRTFs measured on the same dummy head in different labs by Andreopoulou et al. [8]. Yet, comparable studies on humans are rare. Møller et al. [9] investigated inter-participant variations and repeatability measurements on one subject. Riederer [10] investigated mainly intra-subject effects in the same hardware and lab set-up. He also investigated the influence on HRTF variability by changing the experimenter which is comparable to the presented study. Andreopoulou et al. [11] investigated the influence by changing a number of variables, namely: the room used, loudspeaker set-up, repositioning the microphones and the participants alignment in the loudspeaker array. Besides the fact that they investigate blocked ear canal measurements, the study is the closest to the presented study as can be seen in Section 2.1.2. All investigations point towards higher intra-subject repeatability for frequencies up to the ear canal resonance (between 2000 Hz and 3000 Hz) and above up to 5000 Hz.
For literature on HpTF variability, a variety of investigations can be found. To name a few: Shaw [12] investigated ear canal pressures due to different headphone types and three repositions. Møller et al. [5] measured 14 different headphones on 40 participants at the blocked ear canal. Kulkarni and Colburn [3] investigated the variability due to repositioning of headphones on an artificial head. More recently, inter- and intra-subject variability of blocked ear canal measurements have been investigated by Völk [6]. All studies conclude low and smooth variabilities due to repositioning for lower frequencies (around 1–2 dB), moderate deviations around the ear canal resonance (2–3 dB) but still low up to 5000–6000 Hz, and higher variations (up to 10–15 dB) for frequencies above 10 kHz. The most likely reason for the observed variabilities are high-Q notches with different centre frequencies and magnitudes. This study presents HpTF measurements of subjects at two different sites. As set-up and equipment at both sites are equal and environmental factors like room acoustics are negligible for these kind of measurements, differences are expected in microphone placement and post-processing of the measurements.
Besides analysing the variability in physical parameters across laboratories, the obtained transfer functions are utilized in an evaluation of the loudness mismatch between loudspeaker and headphone presentation in a companion paper [13]. Such mismatches, i.e. level differences at eardrum at equal loudness, have been reported repeatedly since the 1940s [14–16] mostly for low frequencies and closed headphones. The phenomenon was named by the amount of mismatch occurring at low frequencies: “The missing 6 dB”. In 2011, Völk and Fastl [17] showed that the loudness mismatch disappears when applying binaural synthesis and compensation of the headphone transfer function in a blind comparison paradigm. They assume that the loudness mismatch is caused by a mismatch in time and phase relations between left and right ear. Nevertheless, the results from our earlier study [13] with a larger variation across listening conditions showed that some unexplained mismatch still remains – especially across the anechoic rooms in Aachen and Oldenburg, thus calling for a closer look at the underlying variabilities in transfer functions for both sites.
The current paper therefore quantifies the cross-site effects on HRTF and HpTF measurements as well as loudness mismatch experiments. 14 participants travelled to both laboratories, one in Aachen and one in Oldenburg. In each lab a full HRTF set as well as the HpTF for three different headphones were measured. As detailed in [13], a loudness balancing listening test was conducted where the subjects adjusted headphone playback to equal loudness of loudspeaker playback of the same stimulus. Using individual HRTFs and HpTFs, the appropriate levels created at the eardrum, and the mismatch, i.e. level difference at equal loudness, was calculated. While the previous paper explored several factors influencing this mismatch (room, stimulus, binaural parameters of headphone playback), the present study focusses on how the mismatch, and in particular apparent disparities between sites, could be explained by cross-site differences between the underlying HRTF and HpTF data. To this end, we restrict ourselves to the loudness balancing results obtained in anechoic environments with diotic headphone playback, but consider the results of all three headphones and a wider frequency range of the employed stimuli (125 Hz to 12 kHz).
2 Methods
2.1 Technical measurements
2.1.1 Probe tube measurements
To measure the sound pressure level close to the eardrum, a probe tube was inserted into the ear canal until participants noticed a soft contact with the eardrum. After slightly pulling back the probe tube, the microphone and its housing were fixed with medical tape on the subjects’ cheek to minimize the influence of the measurement device on the fitting of the headphones and on the incident sound field. The 76 mm long probe tubes (Type 76109MBB, Precision Cast Plastic Parts, Redding, CA, USA) were used on ER7C series probe microphones (ER7C, Etymotic Research, Elk Grove Village, IL, USA). Once placed and fixed, the probe tubes were not repositioned between HpTF and HRTF measurement.
2.1.2 HRTFs
Both sites have very different approaches to measure the head-related transfer functions as described in the following.
In Oldenburg, the measurements were done in an anechoic chamber (volume: 274 m3; wedge length: 0.6 m) with a fixed loudspeaker set-up. A fixed 3D loudspeaker array comprising circles at different elevations is employed. The loudspeakers are positioned with intervals of 7.5 degrees in the horizontal plane and 30 degree in azimuth for elevations of −30 and 30 degree. At 60 degree elevation a spacing of 60 degree is chosen, leading to sum of 87 directions. A more detailed description of the set-up and the procedure can be found in [18]. The participants were seated and equipped with absorbers on their legs to reduce reflections. The ear height of the participant was adapted to the acoustic axis of the loudspeakers mounted in the horizontal plane. The measurement time in Oldenburg was about 30 s, and participants’ head position and orientation were tracked to provide visual feedback about their alignment with the loudspeaker set-up [19]. The measured impulse responses were time windowed using a frequency dependent time window approach [20] and divided by the microphone sensitivity and loudspeaker responses separately. The loudspeakers used were two-way Genelec 8030 with two types of drivers, one 130 mm in diameter and one 19 mm, with a crossover frequency at 3000 Hz. The spatially separated sources lead to angular differences around ±1.3° [18]. Below 60 Hz, the impulse responses were extrapolated to a flat response. The final response was time shifted by 1 ms and truncated to 356 samples including a 12 sample ramp at the beginning and a 24 sample ramp at the end. A sample rate of 44.1 kHz was used.
In Aachen, participants were measured standing on a turntable in a hemi-anechoic chamber (volume: 296 m3; wedge length: 0.8 m) with a vertical 64 loudspeaker arc as described in [21]. The loudspeaker closest to the horizontal plane differs in elevation by −0.54 degree. A neck-rest was used to reduce movement while the participant was rotated and the set-up adapted to match the participants ear height with the centre point of the arc. Loudspeaker used were one inch (25.4 mm) Tang Band W1-2025SA. To reduce measurement time and to match directions used in the Oldenburg set-up the horizontal resolution was set to 7.5 degrees resulting in 3072 measured directions and a duration of about 9 min for one participant. No feedback about the participants head position was given. The impulse responses were time windowed to exclude floor reflections, and divided by the complex transfer function of the microphones measured in the empty arc. Below 500 Hz, the data was extrapolated to 0 dB at 0 Hz preserving the phase information. The final response was time-shifted and truncated to 356 samples at a sample rate of 44.1 kHz with identical ramps as in the Oldenburg data.
The differences in measurement procedures summarized are (Aachen – Oldenburg):
participants posture (standing – seated),
participants movement (turntable – fixed),
feedback to the participants about their alignment with the set-up (none – tracked),
number of direction measured (3072 – 87),
type of loudspeaker used (passive one-way 25.4 mm driver – active two-way 130 and 19 mm driver),
post-processing:
one reference measurement including microphone and loudspeaker – independent compensation of loudspeaker and microphones,
different low frequency cut-off (500 Hz–60 Hz),
duration of measurement (9 min vs. 30 s).
2.1.3 HpTFs
HpTFs were measured in Oldenburg and Aachen with duplicates of the same sound card with integrated high-power headphone amplifier (ADI-2 PRO FS, RME, Haimhausen, Germany). The headphones used were repositioned by the experimenter between measurements and each headphone was measured eight times for each participant to account for variabilities due to fitting [22]. Measurements that revealed obvious faults, e.g. broadband level reduction due to clogging or squeezing of probe tubes, those including false notches due to microphone misplacements and those with a non-sealing fit of the rubber domes for the earphones, were excluded. The probe tubes were not repositioned between measurements.
The sensitivity and frequency response of the probe tube microphones were acquired via the substitution method as described in IEC 61094-8 [23] in the anechoic chambers. In Aachen they were compared to a GRAS 40AF half inch microphone while in Oldenburg a GRAS 46-DP1 eighth inch microphone was used. The measurements were shifted to a common delay and windowed to a length of 93 ms (4096 samples at 44.1 kHz). Hence, the HpTFs are described as a transfer factor from a given headphone voltage input to a measured sound pressure close to the eardrum, i.e. [Pa/V], containing the characteristics of the headphone, its fitting and the ear physiology of the individual participant. The headphones measured included the circumaural, open type Sennheiser HD650 (Sennheiser, Wedemark, Germany), the circumaural, closed housing Beyerdynamic DT770 Pro 250 Ohm (Beyerdynamic, Heilbronn, Germany) and insert earphones Etymotic ER4-PT with double silicon domes (Etymotic Research, Elk Grove Village, IL, USA). The latter one will also be considered as part of the generic term “headphones”. The selection of the headphones is somewhat arbitrary, but they are all in wide spread use. For the HpTF measurements differences between the labs are mainly expected due to post-processing and in acquiring of the microphone sensitivity and its frequency response. At Aachen and Oldenburg, different pairs of headphones were used, which were acquired in one batch.
2.2 Sound pressure level estimation during headphone and loudspeaker presentation
To calculate the eardrum sound pressure level during headphone presentation the stored stimulus Sdig in digital units [DU] is multiplied with the gain G [V/DU] which was set during the listening test to achieve equal loudness and which already includes the digital to analogue converter. It is then convolved with the previously, individually measured HpIR [Pa/V], which is the inverse Fourier transform of the HpTF (see Sect. 2.1.3), to acquire a pressure signal at the eardrum. Both ear sides and signals obtained using all eight repeated HpIRs were averaged in terms of RMS (root-mean-square) values. Variability due to repositioning of the headphones, between subjects and between labs, is analysed in Section 3.2. For the eardrum levels during loudspeaker presentation the calculation is different. Prior to each listening test session, the loudspeaker presentation was calibrated using a calibrated, half-inch free-field microphone (46AF, G.R.A.S., Holte, Denmark) pointing towards the loudspeaker to ensure a playback level at the receiver position of 65 phon. The calibration was done for each stimulus separately and provided a one channel free-field stimulus Srec [Pa] as sound pressure signal. The recorded stimulus was then convolved with the corresponding two-channel HRIR, which is the inverse Fourier transform of the HRTF (see Sect. 2.1.2), to obtain the sound pressure waveform at the eardrums.
To understand the influence of measured HpTF and HRTF values on the results of the listening test we briefly formulate the mismatch (with “*” denoting a convolution) as:
![Mathematical equation: $$ \begin{array}{l}\mathrm{Mismatch}\enspace [\mathrm{dB}]=\\ \enspace 20\middot \mathrm{lo}{\mathrm{g}}_{10}\left(\left({S}_{\mathrm{dig}}\left[\mathrm{DU}\right]\middot \mathrm{G}\left[\frac{\mathrm{V}}{\mathrm{DU}}\right]\right)\enspace \mathrm{*}\enspace \mathrm{HpIR}\left[\frac{\mathrm{Pa}}{\mathrm{V}}\right]\right)\\ \enspace -20\middot \mathrm{lo}{\mathrm{g}}_{10}\left({S}_{\mathrm{rec}}\left[\mathrm{Pa}\right]\enspace \mathrm{*}\enspace \mathrm{HRIR}\left[\frac{\mathrm{Pa}}{\mathrm{Pa}}\right]\right).\end{array} $$](/articles/aacus/full_html/2021/01/aacus210058/aacus210058-eq1.gif) (1)
(1)
Therefore, higher levels in an HpTF measurement will generally increase the observed mismatch, whereas higher values in the HRTF measurement will decrease it. Both transfer functions were measured in the (hemi-) anechoic chambers of the appropriate site.
2.3 Listening test
A loudness balancing test was conducted in Aachen and Oldenburg including the 14 participants travelling to both sites. Participants had to state whether they perceived the headphone or the loudspeaker presentation as louder, taking on and off the headphone between the presentations. A 1-up-1-down two alternate forced choice (AFC) design adapted the headphone level until equal loudness perception was achieved. Participants were seated and the loudspeaker positioned 2.25 m in front of them. More details about the listening test can be found in [13].
As independent variables three different headphones used (see Sect. 2.1.3), two rooms (see Sect. 2.1.2) and nine stimuli were used. As stimuli one-third octave band noises (tbn) were used with centre frequencies at 125 Hz, 250 Hz, 500 Hz, 1000 Hz, 2000 Hz, 4000 Hz, 8000 Hz and 12 kHz. The overall length of each stimulus was 1 second including 20 ms ramps to fade in and out. To cover combined effects a wide band noise between 20 Hz and 4 kHz was used with the same energy in the 17 critical frequency bands as described by Zwicker [24] and will be further related to as “uen17” as short term for unified excitation noise.
3 Results
3.1 HRTFs
The upper row of Figure 1 shows all magnitude spectra taken in Aachen and Oldenburg for a frontal source, i.e. each participant is represented with two measurements here. The measurements converge towards lower frequencies as they are extrapolated towards 0 Hz. Frequencies above approximately 6000 Hz show higher fluctuations. The individual differences are caused by individually distributed centre frequencies of dips and notches due to individual geometries. This plot displays both inter-individual and cross-site deviations.
 |
Figure 1 The upper row shows HRTF magnitude levels over a continuous frequency spectrum of a frontal sound source of participants that were measured at both sites using probe tube microphones positioned close to the eardrum. Left diagram relates to the left and the right diagram to the right ear. Red line shows the median, in transparent blue the range of 75% of measurement data around the median is plotted. Gray lines indicate an individual measurement. Dashed lines indicate a measurement in Aachen, dotted lines measurements in Oldenburg. The bottom row shows the difference in measurements for each participant between the HRTF measured in Aachen and Oldenburg for a frontal source. For the bottom diagrams, the median is averaged with one-twelfth octave band moving averaging window. |
For each participant, two HRTF measurements were conducted: one in Aachen and one in Oldenburg. The difference of these measurements (across laboratories) is plotted as grey line for each participant in the bottom row of Figure 1. As only one HRTF dataset per subject and laboratory site was gathered, the influence of intra-subject repeatability at one site can not be quantified with the data present.
Up to 6000 Hz, the median difference across laboratory sites is below 2.7 dB with an exception around 1600 Hz (left ear, median: 3.2 dB, range: 0.11–5.02 dB). Another systematic deviation can be seen at a frequency of about 500 Hz with a smaller effect (left ear, median: +0.94 dB, range: +0.12 to +1.49 dB). For higher frequencies, a tendency towards negative deviations (higher values in Oldenburg compared to the ones in Aachen) can be observed. The prominent notches differ between left ear (about −8 dB median at 9400 Hz) and right ear (−9.5 dB median at around 11.5 kHz and −12 dB median at 13.8 kHz).
3.2 HpTFs
3.2.1 Variability across transfer functions
Figure 2 shows the HpTF magnitude spectra for the three different headphones used. Note that the y-axis is offset for the ER4 measurements. Comparable to Figure 1, this plots combines inter-subject effects as well as across-site ones. Each grey line displays the mean of the magnitude over up to eight repetitions. The amount of deviation in low frequencies dependent on the headphone type used and is small for the HD650, moderate for the DT770 and highest for the ER4 insert earphones. Up to 5000 Hz differences between measurements are small compared to those for higher frequencies. All HpTFs have a maximum around 3000 Hz (ear canal resonance) and decrease towards very high frequencies. The HD650 shows the flattest overall frequency curve. The DT770 has a wide, prominent notch between 200 and 250 Hz and a smaller one around 3800 Hz that can be observed on both ear sides. For the ER4 the decreasing curve towards very low frequencies as well as the increasing variance towards those frequencies is noticeable as well as a peak around 15.5 kHz.
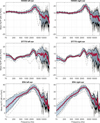 |
Figure 2 HpTF magnitude levels for participants measured in Aachen and Oldenburg separated by left and right ear. Plotted is the mean over eight repetitions of the frequency magnitude. The sound pressure was measured close to the eardrum using probe tubes. The range of the y-axis differs for the ER4 measurements at the bottom. Red line shows the median, in transparent blue the range of 75% of measurement data around the median is plotted. Gray lines indicate the mean of one individual participant over up to eight repetitions. Dashed lines indicate a measurement in Aachen, dotted lines measurements in Oldenburg. |
3.2.2 Intra-subject comparison
After measuring the HpTF of a participant, it usually can not be assured that the fitting of the headphones is invariant against repositioning during the listening test. Especially in loudness balancing tests headphones usually have to be repositioned many times. Figure 3 shows the difference between the maximum magnitude level measured in eight repetitions of fitting and the minimum level for each frequency bin.
 |
Figure 3 Maximum deviations for repositioning the headphones eight times for each participant in Aachen and in Oldenburg. For each frequency the maximum level [dB] minus the minimum over up to eight repetitions is taken. Left diagram relates to the left and the right diagram to the right ear. Red line shows the median (smoothed by one-twelfth moving average window). In transparent blue the range of 75% of measurement data around the median is plotted. Gray lines indicate an individual measurement. Dashed lines indicate a measurement in Aachen, dotted lines measurements in Oldenburg. |
For the open HD650 these differences are small (less than 1.4 dB for the upper boundary) between 90 and 2500 Hz. Between 2500 and 5000 Hz the deviations slowly increase up to 2.8 dB for the upper bound and a median of 1.4 dB. For higher frequencies the variation increases more rapid and repeatability can not be assumed in a reasonable range.
For the DT770 a range between about 500 Hz and 2300 Hz is below 1.5 dB for the upper bound with a median below 0.8 dB. Towards 90 Hz the variability slowly increases up to a value of 4.5 dB for the upper bound and 2.8 dB median on the right ear side. From 2300 to 6000 Hz the variability also slowly increases up to a value of 3.8 dB for the upper bound and 2.5 dB for the median. For higher frequencies observations comparable to those of the HD650 can be made.
The ER4 has deviations up to 15 dB for the upper bound at 90 Hz with a median of 7.4 dB. Deviations decrease with increasing frequency due to the reduced influence of the random leakage effect of the insert earphone. In a range between 900 Hz and 3500 Hz the upper bound stays below 2.6 dB with a median below 1.3 dB. From 3500 Hz towards 6000 Hz the deviations again increase slowly up to an upper bound of 6.4 dB and a median of 2.6 dB. Towards higher frequencies the deviations increase even faster than for the HD650 and the DT770.
3.2.3 Cross-site comparison
Figure 4 shows the difference in magnitude between the mean of HpTF obtained in Aachen and Oldenburg (HPTFAachen − HPTFOldenburg) for the same participant as grey line for all 14 subjects. It has to be noted that the cross-site effects plotted here are inherently influenced by the intra-subject variability as shown in the previous section. The measurements for HD650 and the DT770 coincidence quite well in the range of the intra-subject variability up to 5000 Hz (see Fig. 4). The only exception occurs on the left ear around 2000 Hz which is mainly influenced by two measurements only. The ER4 insert earphones deviate more for the lower frequencies than can be predicted from intra-subject variability (see Fig. 4). No measurement deviations lie in the range of approximately 0 to −10 dB which suggests a more systematic effect. For frequencies higher than 5000 Hz the variance of deviation increases while the median does not show a consistent behaviour between ear sides or headphones. Towards higher frequencies the measurements done in Aachen result in a somewhat higher level especially in the region between 12 kHz and 13 kHz.
 |
Figure 4 Deviations of the obtained HpTF spectra for each participant across sites for the HpTF magnitude spectra for the different headphones separated by left and right ear. Microphones were positioned close to the eardrum using probe tubes. Left diagram relates to the left and the right diagram to the right ear. Red line shows the median (smoothed by one-twelfth moving average window), in transparent blue the range of 75% of measurement data around the median is plotted. Gray lines indicate an individual measurement. |
3.3 Listening test
Figure 5 shows the difference in eardrum sound pressure level between headphone and loudspeaker presentation at equal loudness perception on the y-axis (see Sect. 2.2), and the stimulus on the x-axis. The figure is separated into the two rooms under test.
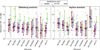 |
Figure 5 Level mismatch obtained from the loudness balancing tests between headphone and loudspeaker presentation for three headphones and 14 subjects across two sites. Each smaller marker is the mean for one participant, each bigger marker the mean over all participants with the whisker indicating the standard deviation. The results are plotted as eardrum sound pressure level difference between headphone and loudspeaker presentation for the same perceived loudness. The x-axis denotes the presented stimulus and the figure is split into the two tested rooms. Each colour represents one specific headphone type. |
Two-way ANOVAs were conducted for each room including a test of simple effects. Significant differences between headphones for a room-stimulus combination are marked in Figure 5 with brackets above each condition. For the uen17 signal, the ER4 insert earphones differ significantly from the other two headphones in both rooms. Additionally, the ER4 differs in the anechoic room in Oldenburg for the DT770 at tbn500 (HD650: p = 0.056) and for both headphones at the tbn250 stimulus. Significance of differences between stimuli are not marked in Figure 5 to keep readability of the figure. In the Aachen anechoic chamber the respective mismatches for the tbn1000 and the tbn12000 differ significantly from other stimuli. In the Oldenburg anechoic chamber the high frequency tbn8000 and tbn12000 differ significantly from the lower ones, with further analysis revealing only a difference for the ER4 for this case and an additional difference to the uen17 stimulus.
3.3.1 Cross-site comparison
Figure 6 shows the differences between the measurements and listening test results for the anechoic rooms in Aachen and Oldenburg. The symbols show the deviation in mismatches (Aachen minus Oldenburg) measured in the listening test plotted over frequency, with the red HD650 and the green ER4 symbols shifted in frequency for readability. Vertical dashed lines indicate the upper and lower boundaries of one-third octave bands employed for the listening tests. The solid lines show the mean deviation of HpTFs (see Fig. 4) minus the mean deviation in HRTF (see Fig. 1 bottom row) between Aachen and Oldenburg. If the lines in a one-third octave band and symbols would coincide, the physical difference in transfer-function measurements would fully explain the deviations in the listening test results between Aachen and Oldenburg. It should be noted that the symbols should not be compared to the value of the corresponding frequency but rather to the whole frequency band which is indicated by the vertical, dashed lines.
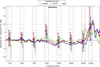 |
Figure 6 Differences in individual mismatch between anechoic rooms in Aachen and Oldenburg. Each small marker is the difference for one specific participant, bigger markers the mean over all participants. Whisker denote the standard deviation. Colours represent one specific headphone type. Solid lines show the calculated mean deviations in mismatch due to the HpTF and HRTF average deviation across sites. The x-axis indicates the frequency with vertical lines showing the boundaries of the one-third octave bands employed for the stimuli in the listening tests. The red markers for HD650 and the green markers for the ER4 are shifted in frequency for better readability. |
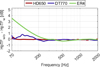 |
Figure 7 Mean differences between measurements on a headphone test fixture measured without probe tubes being present and with probe tubes inserted. The graph shows the difference of the ear simulator measurements, smoothed with an 1/12th octave band moving averaging window. |
4 Discussion
4.1 HRTF measurements
The measurement conditions differed in various points between the labs as listed in Section 2.1.2. Special agreements were only made on the type of probe tube microphones used and the final response parameters (length, overall window and data format) for better comparison as well as evaluation of the listening test.
The deviations across laboratory sites are reasonably small (median below 2.7 dB) up to 6000 Hz. Besides the very different approaches in measuring the HRTFs and the set-up of the measurements, an inherent deviation due to intra-subject repeatability has to be taken into account. Riederer [10] utilizes one seated participant in the same laboratory and measurement set-up with microphones placed at the blocked ear canal to investigate intra-subject repeatability. The HRTFs were measured with three different experimenters inserting the microphones. For the frontal direction, differences for an expert experimenter have been found around 2.7 dB up to 3000 Hz and 10 dB and higher up to 10 kHz when using four repetitions. Measurements at the open ear canal (only two repetitions) showed similar deviations. The values increased with less thorough placed microphones (about 4.4 dB up to 3000 Hz). Møller et al. [9] analysed HRTF repeatability using probe microphones at the open ear canal entrance within the same lab but with only one participant repeated three times. For the frontal direction they showed deviations around 1.5 dB up to about 5000 Hz and up to 15 dB variance above 7000 Hz due to different notch behaviour. Another study by Andreopoulou et al. [11] investigated four participants with 10 repeated measurements under comparable conditions to this study by changing the room and loudspeaker array as well as microphone repositioning and two different experimenters. Although they only showed results for the whole dataset, the same principle applies in which frequencies up to 2000 Hz result in low variations (less than 5 dB) while for higher frequencies these deviations increase up to 15 dB.
Overall, the deviations in the present dataset do not exceed the expected variability due to repetition of the measurement reported on the literature. Yet, some details differ to previous findings and can be accounted to differences between laboratories. The observable systematic peak deviation around 400–500 Hz (see Fig. 1, lower row) can be related to a an additional reflection from the legs that is included in the seated measurements at Oldenburg, but not in the standing measurements at Aachen. Using the ISO/TR 7250-2 [25] database for basic human body measurements the detour for a knee reflection can be calculated to around 2.1–2.5 ms for a german population. The CIPIC database [26], that used seated subjects as well, shows similar values as also mentioned by Raykar et al. [27]. The detour corresponds to a comb-filter with a first notch between 400 and 500 Hz and a second one at three times that frequency, and a peak at the double of the first notch frequency. For higher notches the absorber on the legs suppress reflections from legs or knees. A notch in HRTFs measured in Oldenburg translates to a peak in the subtraction term HRTFAC − HRTFOL. Therefore, the peak around 1600 Hz most likely relates to a reflection effect of the knee and legs as well, with individual centre frequencies for each participant. Earlier measurements conducted in Oldenburg reveal similar behaviour, see Denk et al. [18]. The effect will be further investigated in a separate study.
Another systematic difference can be observed around 10 kHz in the shape of a notch, followed by a peak as shown in the bottom row of Figure 1. The frequency range and the wider characteristics of the deviation point toward a systematically different placement of the probe tubes. Even though the aim was to place them as close as possible to the eardrum, the placement was neither quantified nor measured and performed by different experimenter. Influence of different probe tube placements can be found in e.g. [28, 29] and match quite well with the observed deviations in terms of frequency, notch width and amplitude. Consequently, a peak following the notch would be expected when dividing two transfer functions with different notch centre frequencies.
4.2 HpTF measurements
The HpTF measurements show good repeatability up to about 5000 Hz between repositioning and across laboratory sites, and low variability across subjects. The DT770 shows slightly increased variability towards lower frequencies whereas the HpTFs become unreliable for ER4 insert earphones for frequencies below 900 Hz. Towards higher frequencies intra- and inter-subject variabilities increases for all headphones used whereas systematic influence across laboratory sites can only be observed at 10 kHz and above 13 kHz.
The results found for intra-subject variability due to headphone repositioning in Figure 3 are comparable to the findings of Völk [6]. Even though their investigation focuses on open type headphones only and blocked ear canal measurements, it offers a good reference, especially for the HD650, because of its high number of repetition and the utilization of both, inter- and intra-subject measurements. For the influence of repositioning the HD650 they found variabilities below 1 dB up to 6000 Hz with increased variabilities above these frequencies up to 6 dB whereas the present study shows higher deviations especially for frequencies above 13 kHz, which might relate to the use of probe tubes and the measured sensitivity for the compensation of the microphones. The same is true for the DT770, excluding the slight increase of variability towards lower frequencies. Møller et al. [5] did similar investigations with one subject but multiple headphones. Again, the variation is low for frequencies up to 6000 Hz. Above these frequencies variability increases mainly to slightly shifted peak and notch positions. The across subject effects are naturally affected by the intra-subject variabilities which seem to be a dominant factor for frequencies below 6000 Hz where across subject deviations are comparable to the intra-subject ones as shown in both studies. For higher frequencies, the across subject deviations exceed those for the intra-subjects ones as the centre frequencies of peaks and notches are highly individual.
The differences across laboratories observed in the present study is small and well within the range of intra-subject deviations. Thus, for higher frequencies the probe tube measurements deviate a lot more. The dip around 10 kHz is similar to those found between HRTFs which relate to the microphone placement differences between the two sites as mentioned above. Additional a strong peak towards higher frequency can be seen caused by differences in the microphone compensations (see Fig. 8). Figure 8 shows the transfer function of the post processed data of a Dirac pulse in Aachen and Oldenburg for the ER7C microphones, i.e. the microphone compensation. While deviations are considerably small below 10 kHz, high deviations occur for higher frequencies that can be caused by different fixing of the probe tubes during sensitivity measurements. The probe microphones themselves are stated with signal to noise ratios above 10 dB for frequencies between 10 and 20 kHz. It should be noted that these compensations are also used for the HRTFs in Oldenburg, but not in Aachen (see Sect. 2.1.2).
 |
Figure 8 Transfer function of the microphone compensation in the post processing in Aachen and Oldenburg smoothed by a one-sixth octave band moving average window. The bottom part shows the deviation Aachen minus Oldenburg. Note that the y-axis is split into two areas. |
Another aspect of fitting and leakage is the presence of the probe tube at the pinna cartilage. To analyse the influence of the probe tubes on the measurement the headphones were tested on a GRAS 45CA-9 headphone test fixture with anthropometric pinnae and high resolution ear simulators. Ten measurements were made without probe tubes and ten with probe tubes inserted to the ear canal for each headphone type and probe microphone signals checked for an open probe tube as were done during the HpTF measurements. Mean differences of the ear simulator measurements can be seen in Figure 7.
The results give an estimate about the range in which the effects occur. The coupling surface here is a stiff plane compared to an uneven coupling on a skin surface for human subjects. The probe tubes were only present during HpTF measurements but not during the loudness balancing task. The leakage effect of the probe tubes result in a lower measured amplitude for lower frequencies and, as shown in Section 2.2, lead to decreased mismatches. Yet, this effect can not be observed in Figure 5. However, a tendency towards the inverse behaviour especially in the Oldenburg anechoic room supports the assumption that the effect of a carefully fitted ER4 during the HpTF measurements (where the rubber domes sealed the ear canal) in comparison to an uncontrolled fitting during testing either dominates an effect of the presence of the probe tube or the probe tubes do not significantly affect the fitting. The fitting during the test was done by the participants themselves and no feedback about the sealing (e.g. low frequency test tones) were given. As HpTF measurements with a non-optimal fit of the rubber domes were either sorted out or redone during the measurement phase, a discrepancy to the real HpTF during the listening test, especially for low frequencies, can be expected.
4.3 Influence of measurement uncertainties on the loudness mismatch
Between the settings in Aachen and Oldenburg the results of the loudness balancing experiment do agree quite well. In Figure 6, it can be observed that the deviation in mismatch between sites is generally well within its standard deviation. Only at two frequencies deviations occur, namely at the 1000 Hz one-third octave band and at 12 kHz. The latter can be mapped to the systematic differences in HpTFs (see also Fig. 4) and the used microphone sensitivities. The difference for 1000 Hz can neither be found in the HRTF differences nor in the HpTFs. The discussed deviations around 1600 Hz (see Sect. 4.1) are above the band limits of the one-third octave band noise at 1000 Hz. As the same hardware with synchronized settings were used at both sites, the digital headphone output levels measured in Aachen and Oldenburg are comparable to a large extent and the deviation can already be found in this data, before applying any HpTF or HRTF data. Furthermore, differences in geometries of the rooms or reflecting obstacles would affect higher frequencies likewise, yet, this effect can not be observed for stimuli with higher centre frequencies. As discussed in the companion paper [13] multi-modal aspects, especially visuals, might influence the sound perception. E.g.: the listening test set-up in the Aachen hemi-anechoic was placed on a concrete floor with some absorber in front of a single loudspeaker mounted on a stand where in Oldenburg participants were seated in a full anechoic chamber facing a solid 94 loudspeaker array. As mentioned in [13] further investigations using blindfolded participants are on-going.
The effect of probe tube misplacements, as described in the sections above, on the listening test results is minimized as they cancel out in the divisions of HpTF by HRTF data as described in equation (1). This can also be seen in Figure 6, at least for the HD650 and the DT770.
The high variability in the listening test results for the ER4 insert earphones can on the one hand be found in the HpTFs (see Sect. 3.2.2) showing a high variability due to repositioning of the earphones, and on the other hand in any level plots of the listening test results (Figs. 5 and 6). The high number of repositioning of the headphones during the listening test is assumed to increase the expected variability especially as no feedback regarding the seal of the earphones is given. The uen17 stimulus includes frequencies down to 20 Hz and is therefore most critical to low frequency leakage which is stated as the cause for the differences between the headphones at both sites.
Measuring the sound pressure levels with equipped probe tubes during the whole listening test would minimize the uncertainties regarding real sound pressure levels at the eardrum, but increases the effort (and testing time) drastically as a good fit of the microphones has to be verified before every stimulus presentation due to the risk of microphone repositioning with headphone handling. For further understanding of the insert earphone results, a more robust measurement estimation for the sound pressure level at the eardrum has to be used and repositioning of the earphones has to be done with more control over correct fitting and reproducibility. A test device including a microphone would be an option as in e.g. Hiipakka et al. [30].
A preceding pilot study by the authors [31], presenting a similar loudness balancing experiment, showed a significant difference around 250 Hz between the use of HD650 and DT770 when calculating the eardrum levels with KEMAR HpTFs and HRTFs. The same can be found in the results gathered in this study: When using the measured digital gains together with KEMAR HpTF and HRTF data, the difference occurs again. This indicates that individual eardrum level estimation affects the outcome of loudness balancing, especially for lower frequencies when fitting becomes more important.
5 Conclusion and outlook
The study presented confirms the comparability of findings between laboratories when measuring transfer functions and highlights crucial points in the procedures. Even though the approaches of measuring HRTF datasets were very different, the differences in the results are considerably small. Systematic, moderate deviations appear to be related to the posture of the subjects (standing or seating), which typically is influenced by the set-up.
For the measurement of HpTFs, both laboratory sites used the same approach and the same hardware. Consequently, the measured data is very alike in a frequency range up to approx. 7 kHz. Deviations at higher frequencies up to 10 dB probably stem from differences in the obtained microphone sensitivities that apparently do not correspond exactly to the difference between microphones and the equalization of the HpTFs with these sensitivities. As the sensitivities were measured only once but used on all measurements at one laboratory site, their influence is highly systematic. For the three different headphones under test, the open HD650 exhibited the flattest frequency response and smallest repositioning variations. The closed DT770 has a noticeable dip around 200 Hz and repositioning induced more variability towards lower frequencies as the closed fit is more sensitive to fitting. The ER4 insert earphones highly depend on the fitting of the sealing of the ear canal using double-dome silicon plugs. This fitting was further influenced by the presence of the probe tubes and led to high variations between labs and between repositioning, the latter particularly towards lower frequencies. However, between the frequency range of about 900 to 3500 Hz the ER4 exhibited reproducible HpTFs. Towards higher frequencies variability increases for all headphones due to shifted peaks and notches in the transfer functions.
Last, the influence of the probe tube position as one possible source of inaccuracy may lead to rather large deviations between measured transfer functions across sites. Yet, this effect cancels out in loudness balancing tests when HpTF and HRTF measurements are done with the same placing of the probe tubes, i.e. they stay fixed between both measurements.
On the one hand, the influence of the transfer functions on the loudness balancing results can be shown for deviations around 12 kHz, where differences in microphone sensitivities lead to high deviations in HpTF measurements between the laboratory sites and consequently in high deviations found for the loudness mismatch at this frequency. Also, the use of individual measurements clears the difference between the use of the HD650 and the DT770 at lower frequencies. On the other hand, deviations in transfer functions can not explain different cross-site differences of the loudness mismatch at 1000 Hz.
The gathered HRTF and HpTF data sets [32] can be used for a more thorough investigation of general (cross-site) measurement accuracy, while the present investigation was focussed mainly on explaining differences in loudness balancing. The data shown here solely focuses on the frontal direction and magnitude differences. Time and phase information, interaural cues as well as influences of incidence angles over the whole sphere can be taken into account. For each participant, blocked ear canal measurements were also taken (except for the insert earphones) and can be compared to the presented eardrum measurements.
Data Availability Statement
The measured head-related and headphone transfer functions (https://doi.org/10.5281/zenodo.4556707 [32]) as well as the listening test results (levels of equal loudness) (https://doi.org/10.5281/zenodo.4556669 [33]) are publicly available.
Acknowledgments
The project was funded by the Deutsche Forschungsgemeinschaft (DFG, German Research Foundation) – Projektnummer 352015383 – SFB 1330 A4. The authors like to thank Simon Kersten for his valuable insights and feedback, Frank Keller-Drees and Meike Renken for placing the probe tubes, Bernhard Eurich for supporting the measurements in Oldenburg and everybody who participated in the listening test.
References
- J. Blauert (Ed.): Communication Acoustics, Springer, Berlin Heidelberg, Berlin, Heidelberg. 2005. [CrossRef] [Google Scholar]
- S. Li, J. Peissig: Measurement of head-related transfer functions: a review. Applied Sciences 10, 14 (2020) 5014. [CrossRef] [Google Scholar]
- A. Kulkarni, H. Steven Colburn: Variability in the characterization of the headphone transfer function. Journal of the Acoustical Society of America 107, 2 (2000) 1071–1074. [CrossRef] [PubMed] [Google Scholar]
- A. Lindau, F. Brinkmann: Perceptual evaluation of headphone compensation in binaural synthesis based on non-individual recordings. Journal of the Audio Engineering Society 60, 1/2 (2012) 137–142. [Google Scholar]
- H. Møller, D. Hammershøi, C.B. Jensen, M.F. Sørensen: Transfer characteristics of headphones measured on human ears. Journal of the Audio Engineering Society 43, 4 (1995) 203–217. [Google Scholar]
- F. Völk: Inter- and intra-individual variability in the blocked auditory canal transfer functions of three circum-aural headphones. Journal of the Audio Engineering Society 62, 5 (2014) 315–323. [CrossRef] [Google Scholar]
- M. Vorländer: Acoustic load on the ear caused by headphones. Journal of the Acoustical Society of America 107, 4 (2000) 2082–2088. [CrossRef] [PubMed] [Google Scholar]
- A. Andreopoulou, D.R. Begault, B.F.G. Katz: Inter-laboratory round robin HRTF measurement comparison. IEEE Journal of Selected Topics in Signal Processing 9, 5 (2015) 895–906. [CrossRef] [Google Scholar]
- H. Møller, M.F. Sørensen, D. Hammershøi, C.B. Jensen: Head-related transfer functions of human subjects. Journal of the Audio Engineering Society 43, 5 (1995) 300–321. [Google Scholar]
- K.A.J. Riederer: Repeatability analysis of head-related transfer function measurements. In: 105th AES Convention, San Francisco, USA, September, 1998. [Google Scholar]
- A. Andreopoulou, A. Roginska, H. Mohanraj: Analysis of the spectral variations in repeated head-related transfer function measurements. In:International Conference in Auditory Displays (ICAD). 2013, pp. 213–218. [Google Scholar]
- E.A.G. Shaw: Earcanal pressure generated by circumaural and supraaural earphones. Journal of the Acoustical Society of America 39, 3 (1966) 471–479. [CrossRef] [PubMed] [Google Scholar]
- F. Denk, M. Kohnen, J. Llorca-Bofí, M. Vorländer, B. Kollmeier: The “missing 6 dB” revisited: Influence of room acoustics and binaural parameters on the loudness mismatch between headphones and loudspeakers. Frontiers in Psychology 12 (2021) 623670. [CrossRef] [PubMed] [Google Scholar]
- L.L. Leo: Acoustic measurements, John Wiley and Sons Inc, New York. 1949. [Google Scholar]
- W.A. Munson, F.M. Wiener: In search of the missing 6 dB. Journal of the Acoustical Society of America 24, 5 (1952) 498–501. [CrossRef] [Google Scholar]
- H. Fastl, W. Schmid, G. Theile, E. Zwicker: Schallpegel im Gehörgang für gleichlaute Schalle aus Kopfhörern oder Lautsprechern, Fortschirtte der Akustik – DAGA, 1995. 1985. [Google Scholar]
- F. Völk, H. Fastl: Locating the missing 6 dB by loudness calibration of binaural synthesis. In: 131st Audio Engineering Society Convention, 2011 1 (2011) 479–490. [Google Scholar]
- F. Denk, S.M.A. Ernst, S.D. Ewert, B. Kollmeier: Adapting hearing devices to the individual ear acoustics: Database and target response correction functions for various device styles. Trends in Hearing 22 (2018) 1–19. [Google Scholar]
- F. Denk, J. Heeren, S.D. Ewert, B. Kollmeier, S.M.A. Ernst: Controlling the head position during individual HRTF measurements and its effect on accuracy. DAGA 2017 Kiel. 2017, pp. 1085–1088. [Google Scholar]
- F. Denk, B. Kollmeier, S.D. Ewert: Removing reflections in semianechoic impulse responses by frequency-dependent truncation. Journal of the Audio Engineering Society 66, 3 (2018) 146–153. [CrossRef] [Google Scholar]
- J.-G. Richter: Fast measurement of individual head-related transfer functions. PhD Thesis, RWTH Aachen University, Germany, 2019. [Google Scholar]
- B. Masiero, J. Fels: Perceptually robust headphone equalization for binaural reproduction. In: 130th AES Convention, Convention Paper 8388, London, UK, 2011. [Google Scholar]
- IEC International Electrotechnical Commission. IEC 61094–8: Measurement microphones – Part 8: Methods for determining the free-field sensitivity of working standard microphones by comparison, 2012. [Google Scholar]
- Eberhard Zwicker: Subdivision of the audible frequency range into critical bands (Frequenzgruppen). Journal of the Acoustical Society of America (Letter to the Editor) 33, 2 (1961) 248. [CrossRef] [Google Scholar]
- International Organization for Standardization. ISO/TR 7250–2: Basic human body measurements for technological design – Part 2: Statistical summaries of body measurements from individual ISO populations, 2010. [Google Scholar]
- V. Ralph Algazi, R.O. Duda, D.M. Thompson, C. Avendano: The CIPIC HRTF database. In: IEEE Workshop on Applications of Signal Processing to Audio and Acoustics, New Paltz, New York. 2001, pp. 99–102. [Google Scholar]
- V.C. Raykar, R. Duraiswami, B. Yegnanarayana: Extracting the frequencies of the pinna spectral notches in measured head related impulse responses. Journal of the Acoustical Society of America 118, 1 (2005) 364–374. [CrossRef] [PubMed] [Google Scholar]
- D. Hammershøi, H. Møller: Sound transmission to and within the human ear canal. Journal of the Acoustical Society of America 100, 1 (1996) 408–427. [CrossRef] [PubMed] [Google Scholar]
- S. Mehrgardt, V. Mellert: Transformation characteristics of the external human ear. Journal of the Acoustical Society of America 61, 6 (1977) 1567–1576. [CrossRef] [PubMed] [Google Scholar]
- M. Hiipakka, M. Tikander, M. Karjalainen: Modeling of external ear acoustics for insert headphone usage. AES: Journal of the Audio Engineering Society 58, 4 (2010) 269–281. [Google Scholar]
- M. Kohnen, F. Denk, J. Llorca-Bofi, M. Vorländer, B. Kollmeier: Loudness in different rooms versus headphone reproduction: Is there a mismatch even after careful equalization? Proceedings of the International Congress on Acoustics 2019, 1 (2019) 7879–7886. [Google Scholar]
- M. Kohnen, F. Denk, J. Llorca-Bofí, B. Kollmeier, M. Vorländer: COAT – Cross-site Oldenburg-Aachener Transfer-functions (2020). https://doi.org/10.5281/zenodo.4556707. [Google Scholar]
- F. Denk, M. Kohnen, J. Llorca-Bofí, M. Vorländer, B. Kollmeier: Levels at eardrum and psychoacoustical data in loudness mismatch experiments (2020). https://doi.org/10.5281/zenodo.4556669. [Google Scholar]
Cite this article as: Kohnen M. Denk F. Llorca-Bofi J. Kollmeier B. & Vorländer M, et al. 2021. Cross-site investigation on headrelated and headphone transfer functions: variabilities in relation to loudness balancing. Acta Acustica, 5, 58.
All Figures
|
Figure 1 The upper row shows HRTF magnitude levels over a continuous frequency spectrum of a frontal sound source of participants that were measured at both sites using probe tube microphones positioned close to the eardrum. Left diagram relates to the left and the right diagram to the right ear. Red line shows the median, in transparent blue the range of 75% of measurement data around the median is plotted. Gray lines indicate an individual measurement. Dashed lines indicate a measurement in Aachen, dotted lines measurements in Oldenburg. The bottom row shows the difference in measurements for each participant between the HRTF measured in Aachen and Oldenburg for a frontal source. For the bottom diagrams, the median is averaged with one-twelfth octave band moving averaging window. |
| In the text | |
|
Figure 2 HpTF magnitude levels for participants measured in Aachen and Oldenburg separated by left and right ear. Plotted is the mean over eight repetitions of the frequency magnitude. The sound pressure was measured close to the eardrum using probe tubes. The range of the y-axis differs for the ER4 measurements at the bottom. Red line shows the median, in transparent blue the range of 75% of measurement data around the median is plotted. Gray lines indicate the mean of one individual participant over up to eight repetitions. Dashed lines indicate a measurement in Aachen, dotted lines measurements in Oldenburg. |
| In the text | |
|
Figure 3 Maximum deviations for repositioning the headphones eight times for each participant in Aachen and in Oldenburg. For each frequency the maximum level [dB] minus the minimum over up to eight repetitions is taken. Left diagram relates to the left and the right diagram to the right ear. Red line shows the median (smoothed by one-twelfth moving average window). In transparent blue the range of 75% of measurement data around the median is plotted. Gray lines indicate an individual measurement. Dashed lines indicate a measurement in Aachen, dotted lines measurements in Oldenburg. |
| In the text | |
|
Figure 4 Deviations of the obtained HpTF spectra for each participant across sites for the HpTF magnitude spectra for the different headphones separated by left and right ear. Microphones were positioned close to the eardrum using probe tubes. Left diagram relates to the left and the right diagram to the right ear. Red line shows the median (smoothed by one-twelfth moving average window), in transparent blue the range of 75% of measurement data around the median is plotted. Gray lines indicate an individual measurement. |
| In the text | |
|
Figure 5 Level mismatch obtained from the loudness balancing tests between headphone and loudspeaker presentation for three headphones and 14 subjects across two sites. Each smaller marker is the mean for one participant, each bigger marker the mean over all participants with the whisker indicating the standard deviation. The results are plotted as eardrum sound pressure level difference between headphone and loudspeaker presentation for the same perceived loudness. The x-axis denotes the presented stimulus and the figure is split into the two tested rooms. Each colour represents one specific headphone type. |
| In the text | |
|
Figure 6 Differences in individual mismatch between anechoic rooms in Aachen and Oldenburg. Each small marker is the difference for one specific participant, bigger markers the mean over all participants. Whisker denote the standard deviation. Colours represent one specific headphone type. Solid lines show the calculated mean deviations in mismatch due to the HpTF and HRTF average deviation across sites. The x-axis indicates the frequency with vertical lines showing the boundaries of the one-third octave bands employed for the stimuli in the listening tests. The red markers for HD650 and the green markers for the ER4 are shifted in frequency for better readability. |
| In the text | |
|
Figure 7 Mean differences between measurements on a headphone test fixture measured without probe tubes being present and with probe tubes inserted. The graph shows the difference of the ear simulator measurements, smoothed with an 1/12th octave band moving averaging window. |
| In the text | |
|
Figure 8 Transfer function of the microphone compensation in the post processing in Aachen and Oldenburg smoothed by a one-sixth octave band moving average window. The bottom part shows the deviation Aachen minus Oldenburg. Note that the y-axis is split into two areas. |
| In the text | |
Current usage metrics show cumulative count of Article Views (full-text article views including HTML views, PDF and ePub downloads, according to the available data) and Abstracts Views on Vision4Press platform.
Data correspond to usage on the plateform after 2015. The current usage metrics is available 48-96 hours after online publication and is updated daily on week days.
Initial download of the metrics may take a while.