Open Access
Figure 12
Download original image
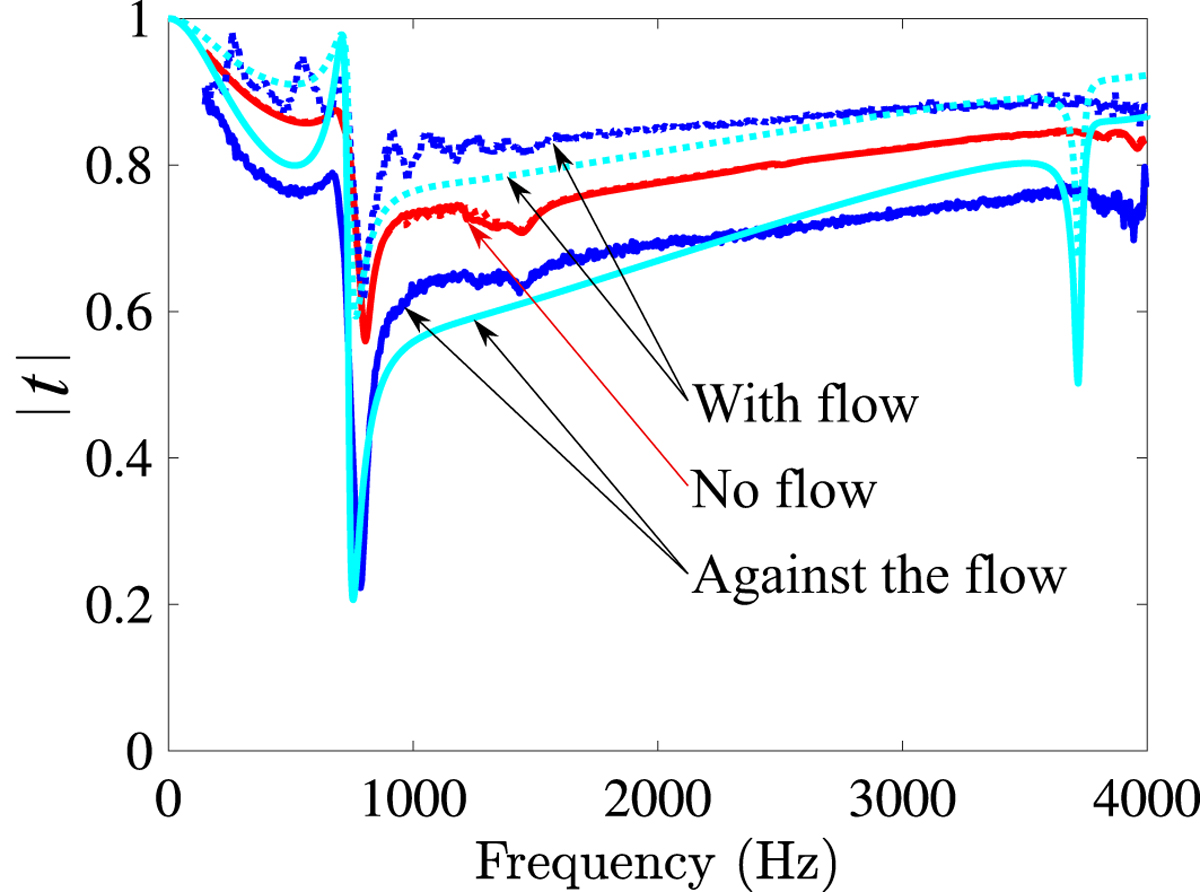
Transmission coefficients of the lined sample in presence of flow (M = 0.25). The experimental results (red curves without flow, blue curves with flow) are compared to the multimodal calculation (only the results with flow are shown, cyan curves).
Current usage metrics show cumulative count of Article Views (full-text article views including HTML views, PDF and ePub downloads, according to the available data) and Abstracts Views on Vision4Press platform.
Data correspond to usage on the plateform after 2015. The current usage metrics is available 48-96 hours after online publication and is updated daily on week days.
Initial download of the metrics may take a while.