Open Access
Figure 9
Download original image
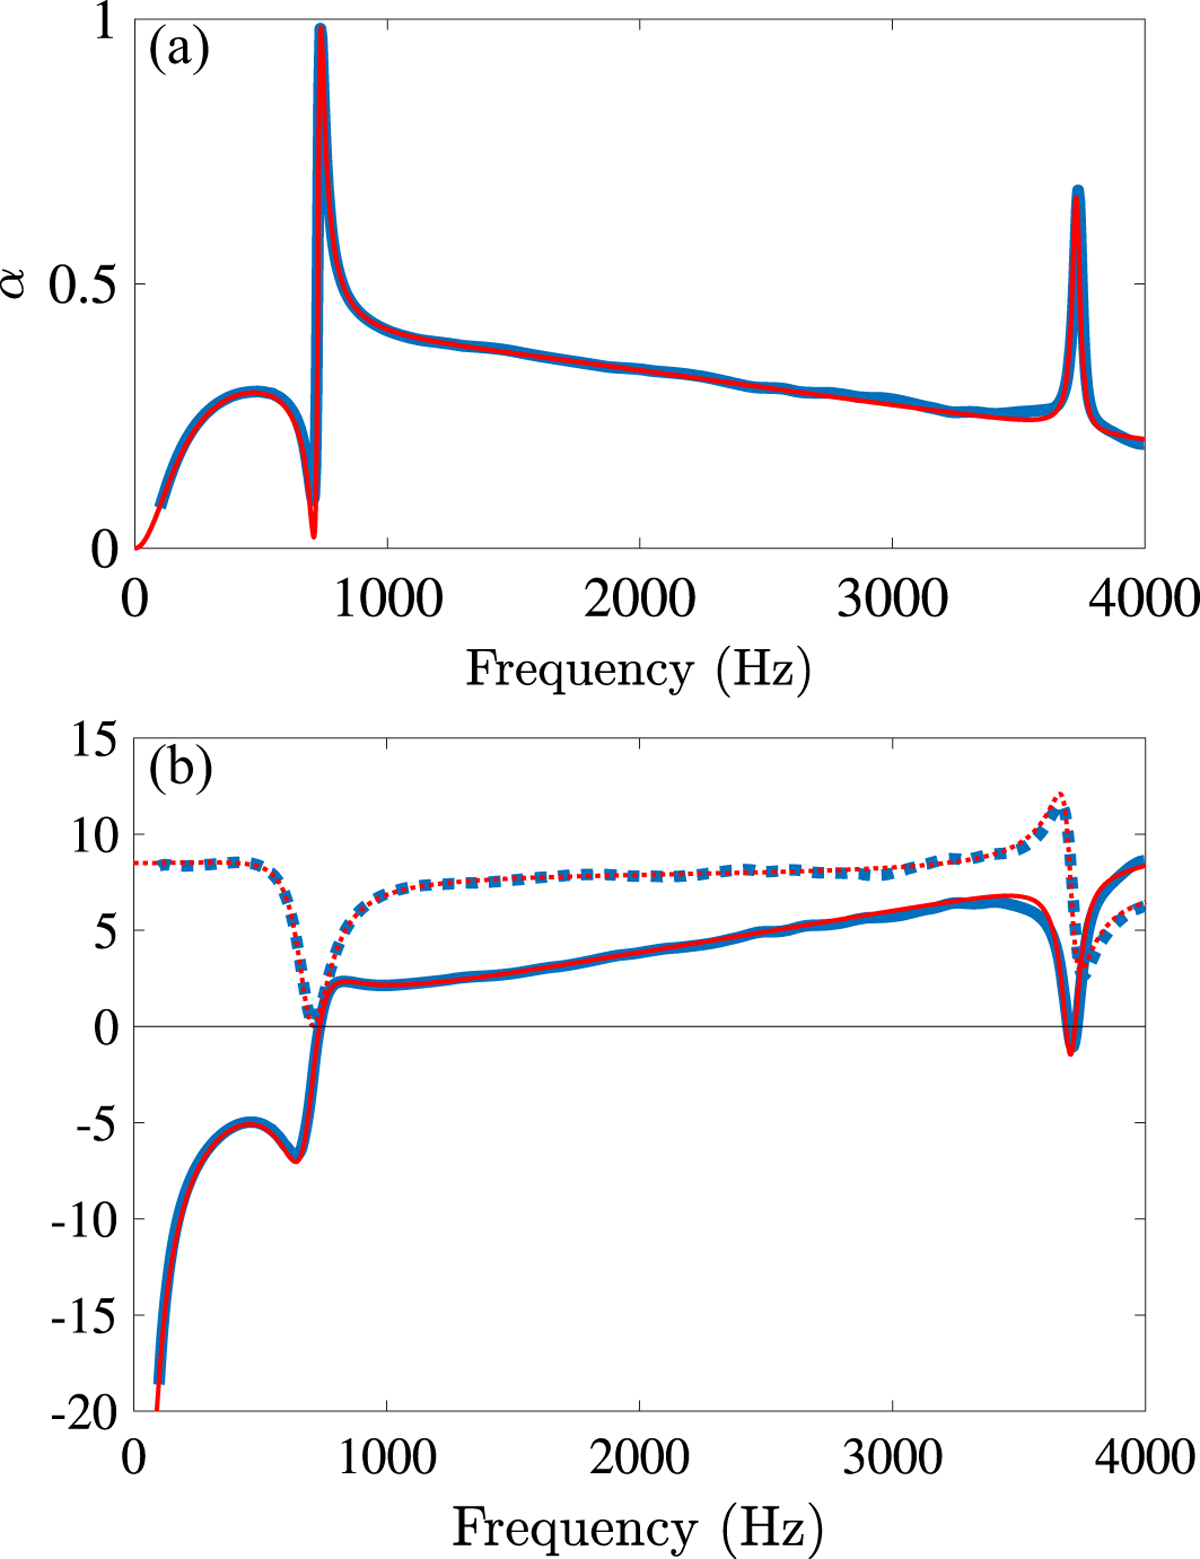
(a) Absorption coefficient and (b) impedance as functions of the frequency. The resistance are displayed by dashed lines and the reactance by solid lines. The experimental results (blue curves) are compared to the analytical results computed with the bi-articulated plate model (red curves).
Current usage metrics show cumulative count of Article Views (full-text article views including HTML views, PDF and ePub downloads, according to the available data) and Abstracts Views on Vision4Press platform.
Data correspond to usage on the plateform after 2015. The current usage metrics is available 48-96 hours after online publication and is updated daily on week days.
Initial download of the metrics may take a while.