Figure A.1
Download original image
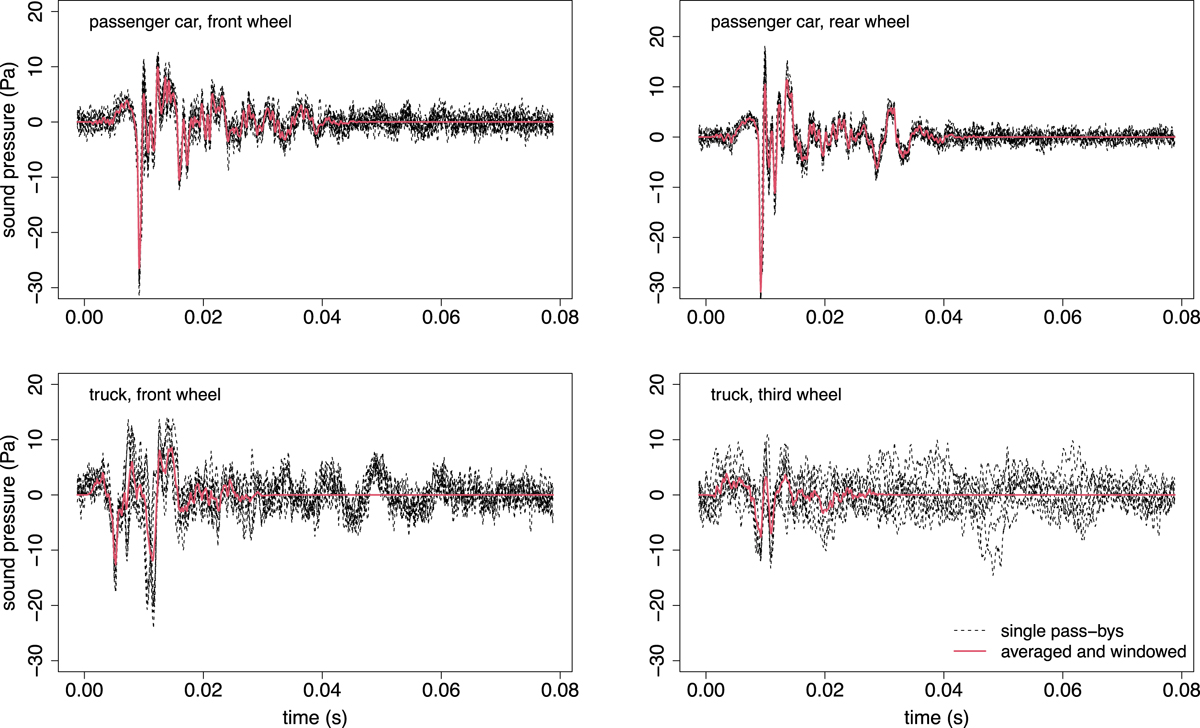
Single-groove measurements for the passenger car and truck. Shown are single pass-overs (black dashed lines) for a good coverage (lower than 2) and the averaged and windowed responses (red line). The upper panels show the front (left) and the rear tire (right) of the passenger car, the lower panels shown the front (left) and the third tire (right) of the truck.
Current usage metrics show cumulative count of Article Views (full-text article views including HTML views, PDF and ePub downloads, according to the available data) and Abstracts Views on Vision4Press platform.
Data correspond to usage on the plateform after 2015. The current usage metrics is available 48-96 hours after online publication and is updated daily on week days.
Initial download of the metrics may take a while.