Figure A.5
Download original image
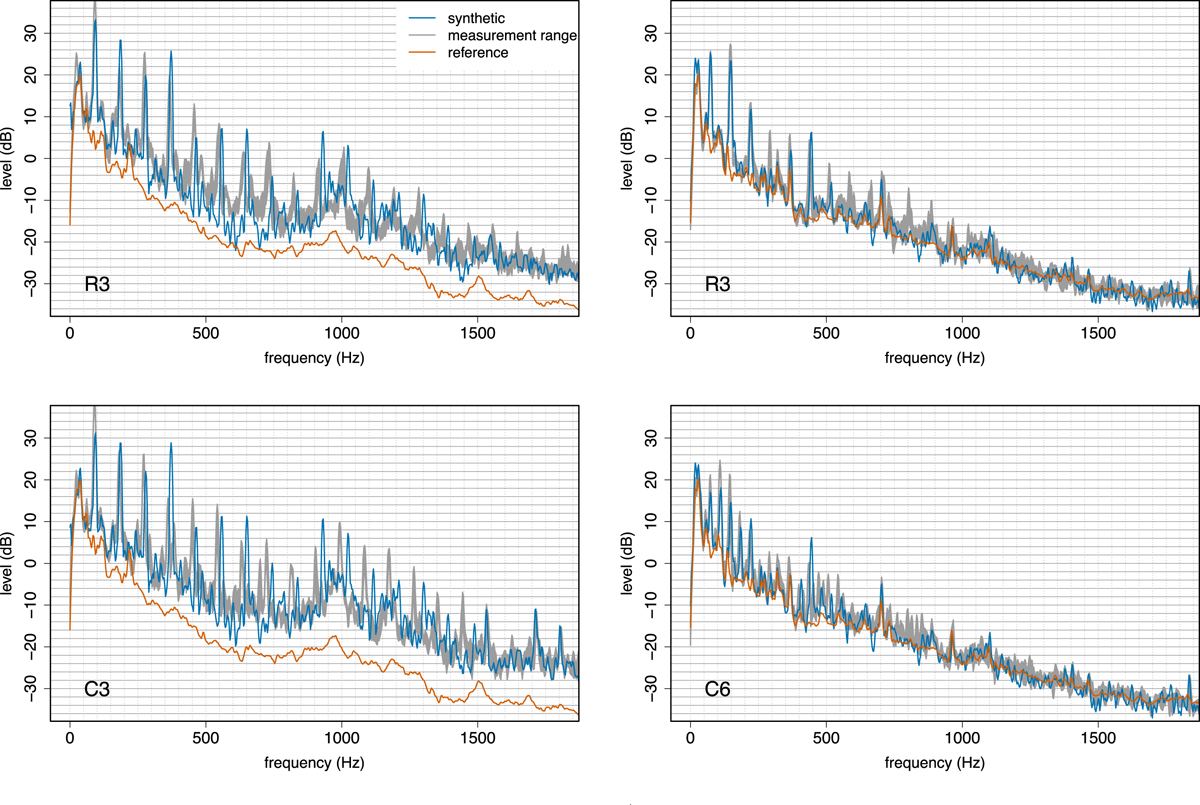
Comparison of measurement and synthesis for the interior of the car (left panels) and the truck (right panels) for two rumble strips. Shown are mean, minimum, and maximum of 5 pass-bys (black lines and gray shaded area) as well as the synthesis (blue line). The upper panels show R3, the lower panels show C3 (C6 for the truck). The orange line shows a regular pass-by.
Current usage metrics show cumulative count of Article Views (full-text article views including HTML views, PDF and ePub downloads, according to the available data) and Abstracts Views on Vision4Press platform.
Data correspond to usage on the plateform after 2015. The current usage metrics is available 48-96 hours after online publication and is updated daily on week days.
Initial download of the metrics may take a while.