Open Access
Figure 9
Download original image
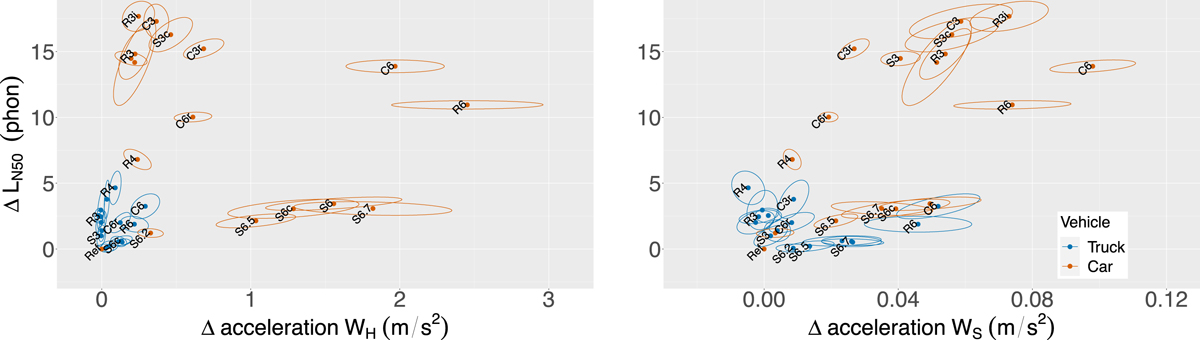
Median loudness level vs weighted vibration levels. Left panel: Vibrations at the steering wheel. Right panel: Vibrations at the seat. The circles show averages and the ellipses the 95% confidence intervals. Data are from the second measurement.
Current usage metrics show cumulative count of Article Views (full-text article views including HTML views, PDF and ePub downloads, according to the available data) and Abstracts Views on Vision4Press platform.
Data correspond to usage on the plateform after 2015. The current usage metrics is available 48-96 hours after online publication and is updated daily on week days.
Initial download of the metrics may take a while.